ACV, or average/annual contract value, isn't as useful a concept as people think.
Though it's easy to forget, ACV is a customer-weighted metric: it tells us something about the customers of the business. However, despite its name, it doesn't tell us much about the revenue profile of the business, which is arguably more important.
Further, the standard ACV metric obscures valuable information about the skewness of monetization / revenue. Thus, we can't use it to compare companies with differing customer concentration.
We need a different SaaS monetization metric.
I present to you: weighted ACV (WACV).
Receive my new long-form essays
Thoughtful analysis of the business and economics of tech
Customer-centric or dollar-centric?
In Enterprise Software Monetization is Fat-Tailed, I talked about the follies of focusing on simple averages, especially in enterprise software:
In enterprise software, the "average" customer is a meaningless concept.
Paying too much attention to the "average" customer leads many founders and investors astray.
Average/annual contract value, or ACV, is one such misleading metric.
$$\text{ACV} = \frac{\text{Total Annual Contract Value}}{\text{Total Customers}}$$
ACV tells you something about the typical customer. Products with small ACVs tend to serve smaller, more fickle customers with a high probability of churning, like small businesses and startups. High ACV products address the needs of larger companies with more mission critical use cases, leading to less churn.
However, while ACV tells you something about how the typical customer might behave, it doesn't tell you much about how the typical dollar of revenue behaves. If 70% of the revenue comes from 20% of the customers, then for the purposes of analyzing revenues at a point in time, it's really only that subset of customers that matter. Such extreme concentration is not unusual for public software companies:
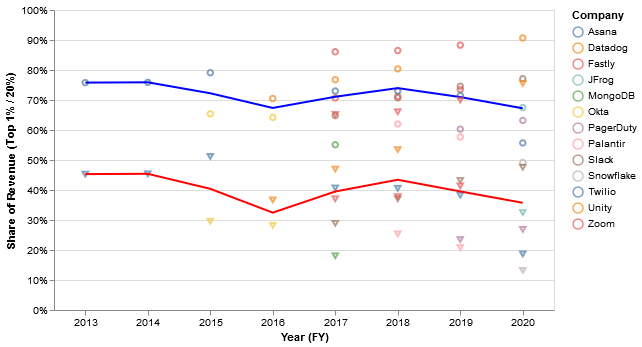
The implied top-20% and top-1% revenue concentration are quite large for most companies (blue = top 20%, red = top 1%)
So, the top 20% typically represent ~70% of revenue, while the top 1% represent ~40%. Not quite Pareto 80/20, but pretty close!
This distinction between customer behavior and revenue behavior is critical, as the behavior of the typical dollar of revenue is much more informative about the quality of revenue and the likelihood that revenue will be retained or expanded. For companies with high revenue concentration, simple averages are largely useless.
This is largely true to this day - for many public enterprise SAAS, a very small # of customers contributes a huge chunk of total rev.
— Masterly Inactive (@masterly_in) December 30, 2021
e.g. ~0.95% of $NET paying customers rep >50% of rev in Q3/21
So why do some analysts still use metrics like ARPU/AARPU for enterprise saas? pic.twitter.com/WXSpWJYfNA
Rather than the exception, high concentration is the norm in certain verticals (e.g. cloud infrastructure) or pricing models (consumption/pay-as-you-go) where a "customer" can be as small as tens of dollars per month:
Interestingly, many companies tied to infrastructure in some way like Datadog, Fastly, and Twilio... have 80/20 monetization distributions, at least in some years.
Unfortunately, the standard ACV metric is incomparable across companies with vastly different customer concentration. A company with many small or "free tier" customers will have an artificially low ACV metric, even if contract sizes are reasonably high among its paying customers. You can't naively compare such a skewed company to another business where every customer is small.
This is why you see public software companies with tons of bottom up but low-paying usage report ACV or other customer metrics including only the customers larger than some nominal spending level, like $5,000 (screenshot from the GitLab S-1):
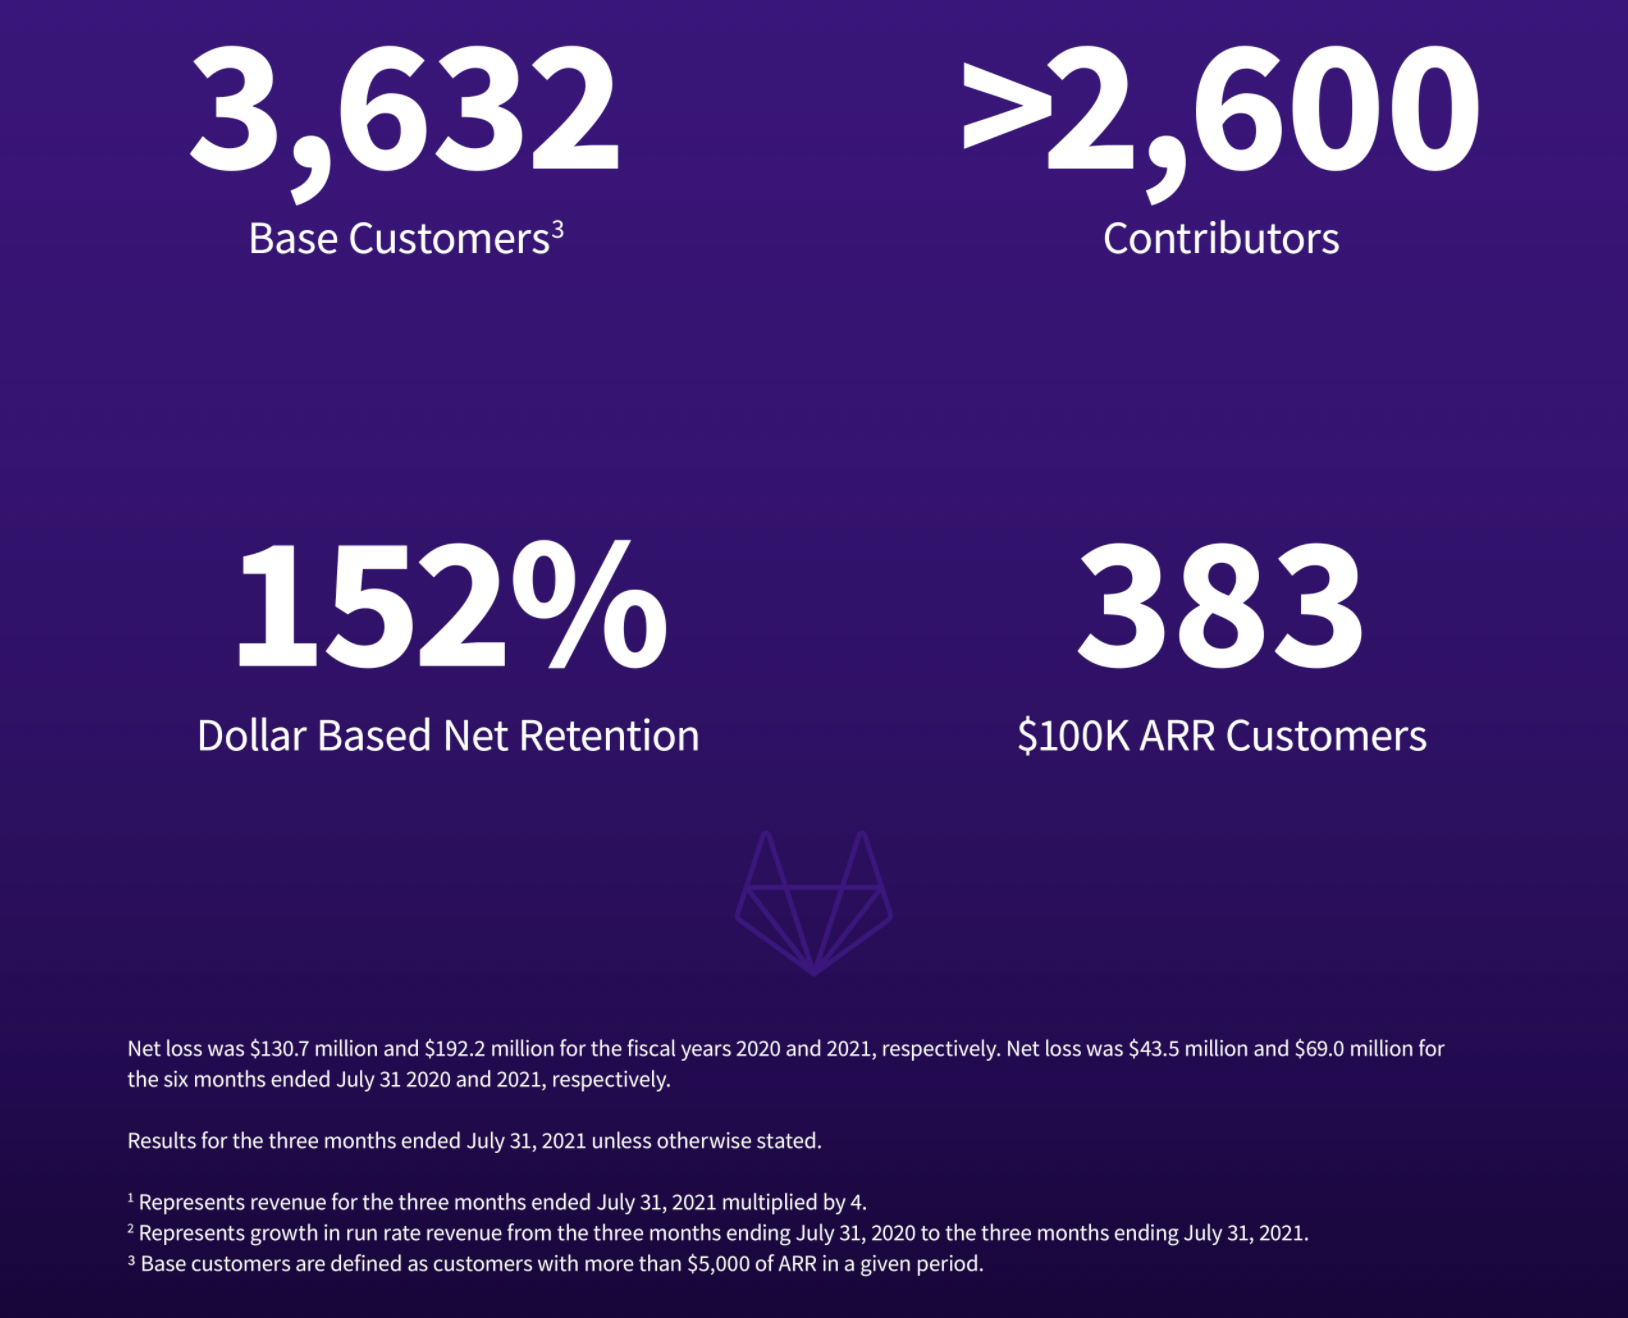
Using arbitrary thresholds is a clunky way of dealing with this problem, as companies can pick any value they want. ACV calculations with different thresholds are effectively incomparable.
Weighing in
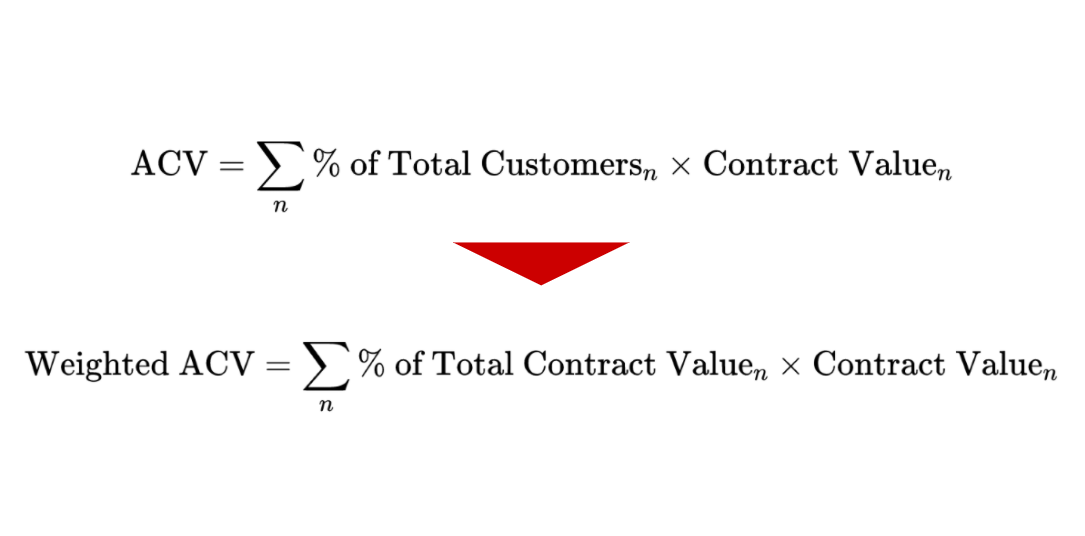
A customer-weighed metric helps you understand customers. ACV is a customer or equal-weighted metric, which is to say every customer is weighted equally. So if there are 1000 customers, the contract value of each customer is "weighted" or multiplied by 1/1000 and then summed up. Because each customer is weighted equally, the resulting metric tells us something about the typical customer. Thus we can rewrite ACV as:
$$\text{ACV} = \sum_n \text{% of Total Customers}_n \times \text{Contract Value}_n$$
However, if you want to understand revenue, you need to use a revenue-weighted metric.
Just like the market capitalization-weighting of the S&P 500 index signals the changing value of the overall equity market (but not of the individual companies in the index), a revenue or contract value-weighted metric tells us much about the overall revenue of the business (rather than the individual customers).
Introducing: weighted ACV (WACV).
Revenue-weighting the revenue each customer generates might sound like double counting, but we need to weight individual customer revenues by something. Nothing limits us to equal-weighting. Revenue-weighting is not only perfectly reasonable, it's the more appropriate methodology when analyzing quality of revenues.
A perfect example is net dollar retention, a common tool for understanding the quality and behavior of software revenues:
- Believe it or not, net dollar retention is also a revenue-weighted metric: it weights the individual dollar retention of each customer by the revenue that customer represents. That's not how the calculation is typically conceptualized, but that is the underlying math (grab some data and prove this to yourself)
- Thus, larger customers matter more for net dollar retention; the churning of a tiny customer has infinitesimal impact.
To calculate weighted ACV:
- Take the contract value of each customer and multiply it by the proportion of revenue that customer represents. A customer representing 1% of revenue gets a 1/100 weight, a customer representing 3% of revenue receives a weight of 3/100, and so on.
- Then sum all those numbers (i.e. SUMPRODUCT, for all you spreadsheet monkeys out there)
$$\text{Weighted ACV} = \sum_n \text{% of Total Contract Value}_n \times \text{Contract Value}_n$$
Weighted ACV tells you where to look if you want to best understand the revenue of the business. For example, a WACV of $25,000 tells us roughly that the typical dollar of revenue is generated by a $25,000 customer. Thus, revenue retention/churn and other revenue dynamics of the business will tend toward what we'd expect for those kinds of customers. Revenue-weighting is especially helpful if the company in question has a large number of customers spending little or zero, contaminating the equal-weighted ACV calculation.
Meanwhile, changes in WACV correspond to changing monetization among the largest chunk of the revenue base. Customers with the biggest revenue impact will have the largest influence on WACV, as with net dollar retention.
If we think about a company as a sort of physical object, its "center of mass" is concentrated at its WACV. Logically, if we want to do physics on this thing or model its movement, what matters most is its center of mass (its weighted ACV), not necessarily its literal "center" (equal-weighted ACV). That's where revenue is most "densely" concentrated.
This concept flips standard monetization logic on its head. Instead of saying "the average customer generates X revenue," as if all revenue comes from a single type of customer, WACV says "Y-size customers generate the average dollar of revenue," respecting the fact that certain customers are disproportionately impactful. ACV asks "what's the expected value of a randomly selected customer" while WACV asks "what's the expected contract size associated with a randomly selected dollar of revenue."
As I'll demonstrate in a second, this is really powerful. In a single number, we capture much more information than the equal-weighted ACV metric by accounting for the skew and concentration of the customer base. In statistics parlance, WACV gives us some sense of the variance of revenues across customers, rather than merely the mean.
Note: this essay focuses on enterprise SaaS monetization, but you can apply the same concept to B2C and other models. E.g. Average Revenue Per User (ARPU) becomes Weighted ARPU (WARPU), and so on.
An example worth its weight in revenue
Two businesses could have the same equal-weighted ACV but wildly different weighted ACVs.
Here's an example to make this vivid.
Imagine two, $50K revenue companies with five customers each, equivalent equal-weighted ACVs, but very different revenue distributions. Company 1 has five equal-sized customers, while Company 2 has a fairly typical skewed distribution, with 20% of customers representing 80% of revenue:
| Company 1 | Company 2 | |
|---|---|---|
| Customer 1 | $10,000 | $40,000 |
| Customer 2 | $10,000 | $2,500 |
| Customer 3 | $10,000 | $2,500 |
| Customer 4 | $10,000 | $2,500 |
| Customer 5 | $10,000 | $2,500 |
| ACV | $10,000 | $10,000 |
| Weighted ACV | $10,000 | $32,500 |
Notice how sensitive WACV is to the more skewed revenue distribution of the second company. It's telling us Company 2's large $40K customer is really dictating the revenue dynamics of the company. For Company 2, the typical dollar of revenue will behave like it's coming from a $32.5K customer, not a $10K customer. The standard ACV metric totally misses this.
Now that we've seen how WACV helps us at a single point in time, let's see what happens to the metric over time. Next month, both companies land a large, $100K deal with a new customer:
| Company 1 | Company 2 | |
|---|---|---|
| Customer 1 | $10,000 | $40,000 |
| Customer 2 | $10,000 | $2,500 |
| Customer 3 | $10,000 | $2,500 |
| Customer 4 | $10,000 | $2,500 |
| Customer 5 | $10,000 | $2,500 |
| Customer 6 | $100,000 | $100,000 |
| ACV | $25,000 | $25,000 |
| Weighted ACV | $70,000 | $77,500 |
Both metrics increase, but weighted ACV increases by a lot more, reflecting the dominance of the new large customer within the revenue base. The standard ACV calculation unwittingly discounts the effect of large customers, muting their impact.
Again, the weighted version of ACV correctly points us towards the largest customers. The "typical" dollar of revenue for both companies will now behave like it's coming from a roughly $70-80K customer, not a $25K customer.
Lastly, the fact that WACV across the companies has converged suggests their revenue concentration is now much more similar, which is exactly right.
VICs: Very Important Customers
One last trick.
Just like dividing total revenue or contract value by ACV yields the total customer count, dividing by weighted ACV tells us something about the customer base. The calculation tells us, on a revenue basis, how many customers really matter. In other words, what minority of customers effectively determines overall revenue?
Let's call them very important customers (VICs):
$$\text{Very Important Customers} = \text{Total Contract Value } / \text{ Weighted ACV} $$
It turns out, this will be a small fraction of the overall customer count for the typical enterprise software company.
Returning to the first example, total revenue was $50K, while weighted ACV was $10K for Company 1 and $32.5K for Company 2. Thus, Company 1 has 5 VICs while Company 2 has 1.5. This tells us that while Company 1 has five relevant and discernibly important customers, Company 2 only has one or two. This accords with the data – in terms of revenue risk or quality of revenue, Company 2 is effectively a one (point five) trick pony:
| Company 1 | Company 2 | |
|---|---|---|
| Total Contract Value | $50,000 | $50,000 |
| Weighted ACV | $10,000 | $32,500 |
| Very Important Customers | 5 | 1.54 |
In the second example, total revenue is now $150K, with weighted ACV of $70K for Company 1 and $77.5K for Company 2. Some quick math yields ~2 very important customers for each company, reflecting their respective revenue concentration. Said differently, you can summarize the entire revenue profile of each company by looking at the two largest customers:
| Company 1 | Company 2 | |
|---|---|---|
| Total Contract Value | $150,000 | $150,000 |
| Weighted ACV | $70,000 | $77,500 |
| Very Important Customers | 2.14 | 1.94 |
Frankly, I find this much more representative of the volatility of revenue. These companies have serious concentration risk, and from a diversification perspective really only have two customers each.
Public software companies have similar concentration, so the same logic applies: very important customers will only be 30-40% of the overall customer base.
With WACV and VICs, founders with high revenue concentration can now rigorously quantify the number and magnitude of meaningful customer relationships they have while avoiding awkward conversations that go something like, "well... we have X total customers, but only Y many are paying us more than Z per year, so if you remove those then our business is really..."
Conclusion
Are there any downsides to weighted ACV?
No, none at all.
Just kidding! The negatives of WACV mirror those of other size-weighting schemes like the S&P 500: it's extremely sensitive to idiosyncratic fluctuations in your largest customers that may not be representative of the broader customer base or long-lasting in nature.
These are fair critiques. However, all can be easily addressed by calculating both weighted and equal-weighted ACV. Coincidently, the difference between the two is a nice measure of customer concentration and the fat-tailedness of monetization: the further apart they are, the more revenue is concentrated among a few customers, and vice versa:
$$\text{Weighted ACV} - \text{Equal-weighted ACV} \approx \text{Customer Concentration}$$
In fact, the main disadvantage of revenue-weighting is that it requires knowing the revenue or contract value of each and every customer. So an outsider can't calculate the metric; it must be reported by the company. You can often approximate it with just data of the top 30-40% of customers, but that won't be perfect.
If you do have enough information to calculate weighted ACV, you should always do it. WACV contains more information than the standard ACV metric, and by definition you can always calculate the latter if you can calculate the former.
If you found this helpful, need help with the calculation, or end up implementing this in your analytics, do let me know!
Receive my new long-form essays
Thoughtful analysis of the business and economics of tech