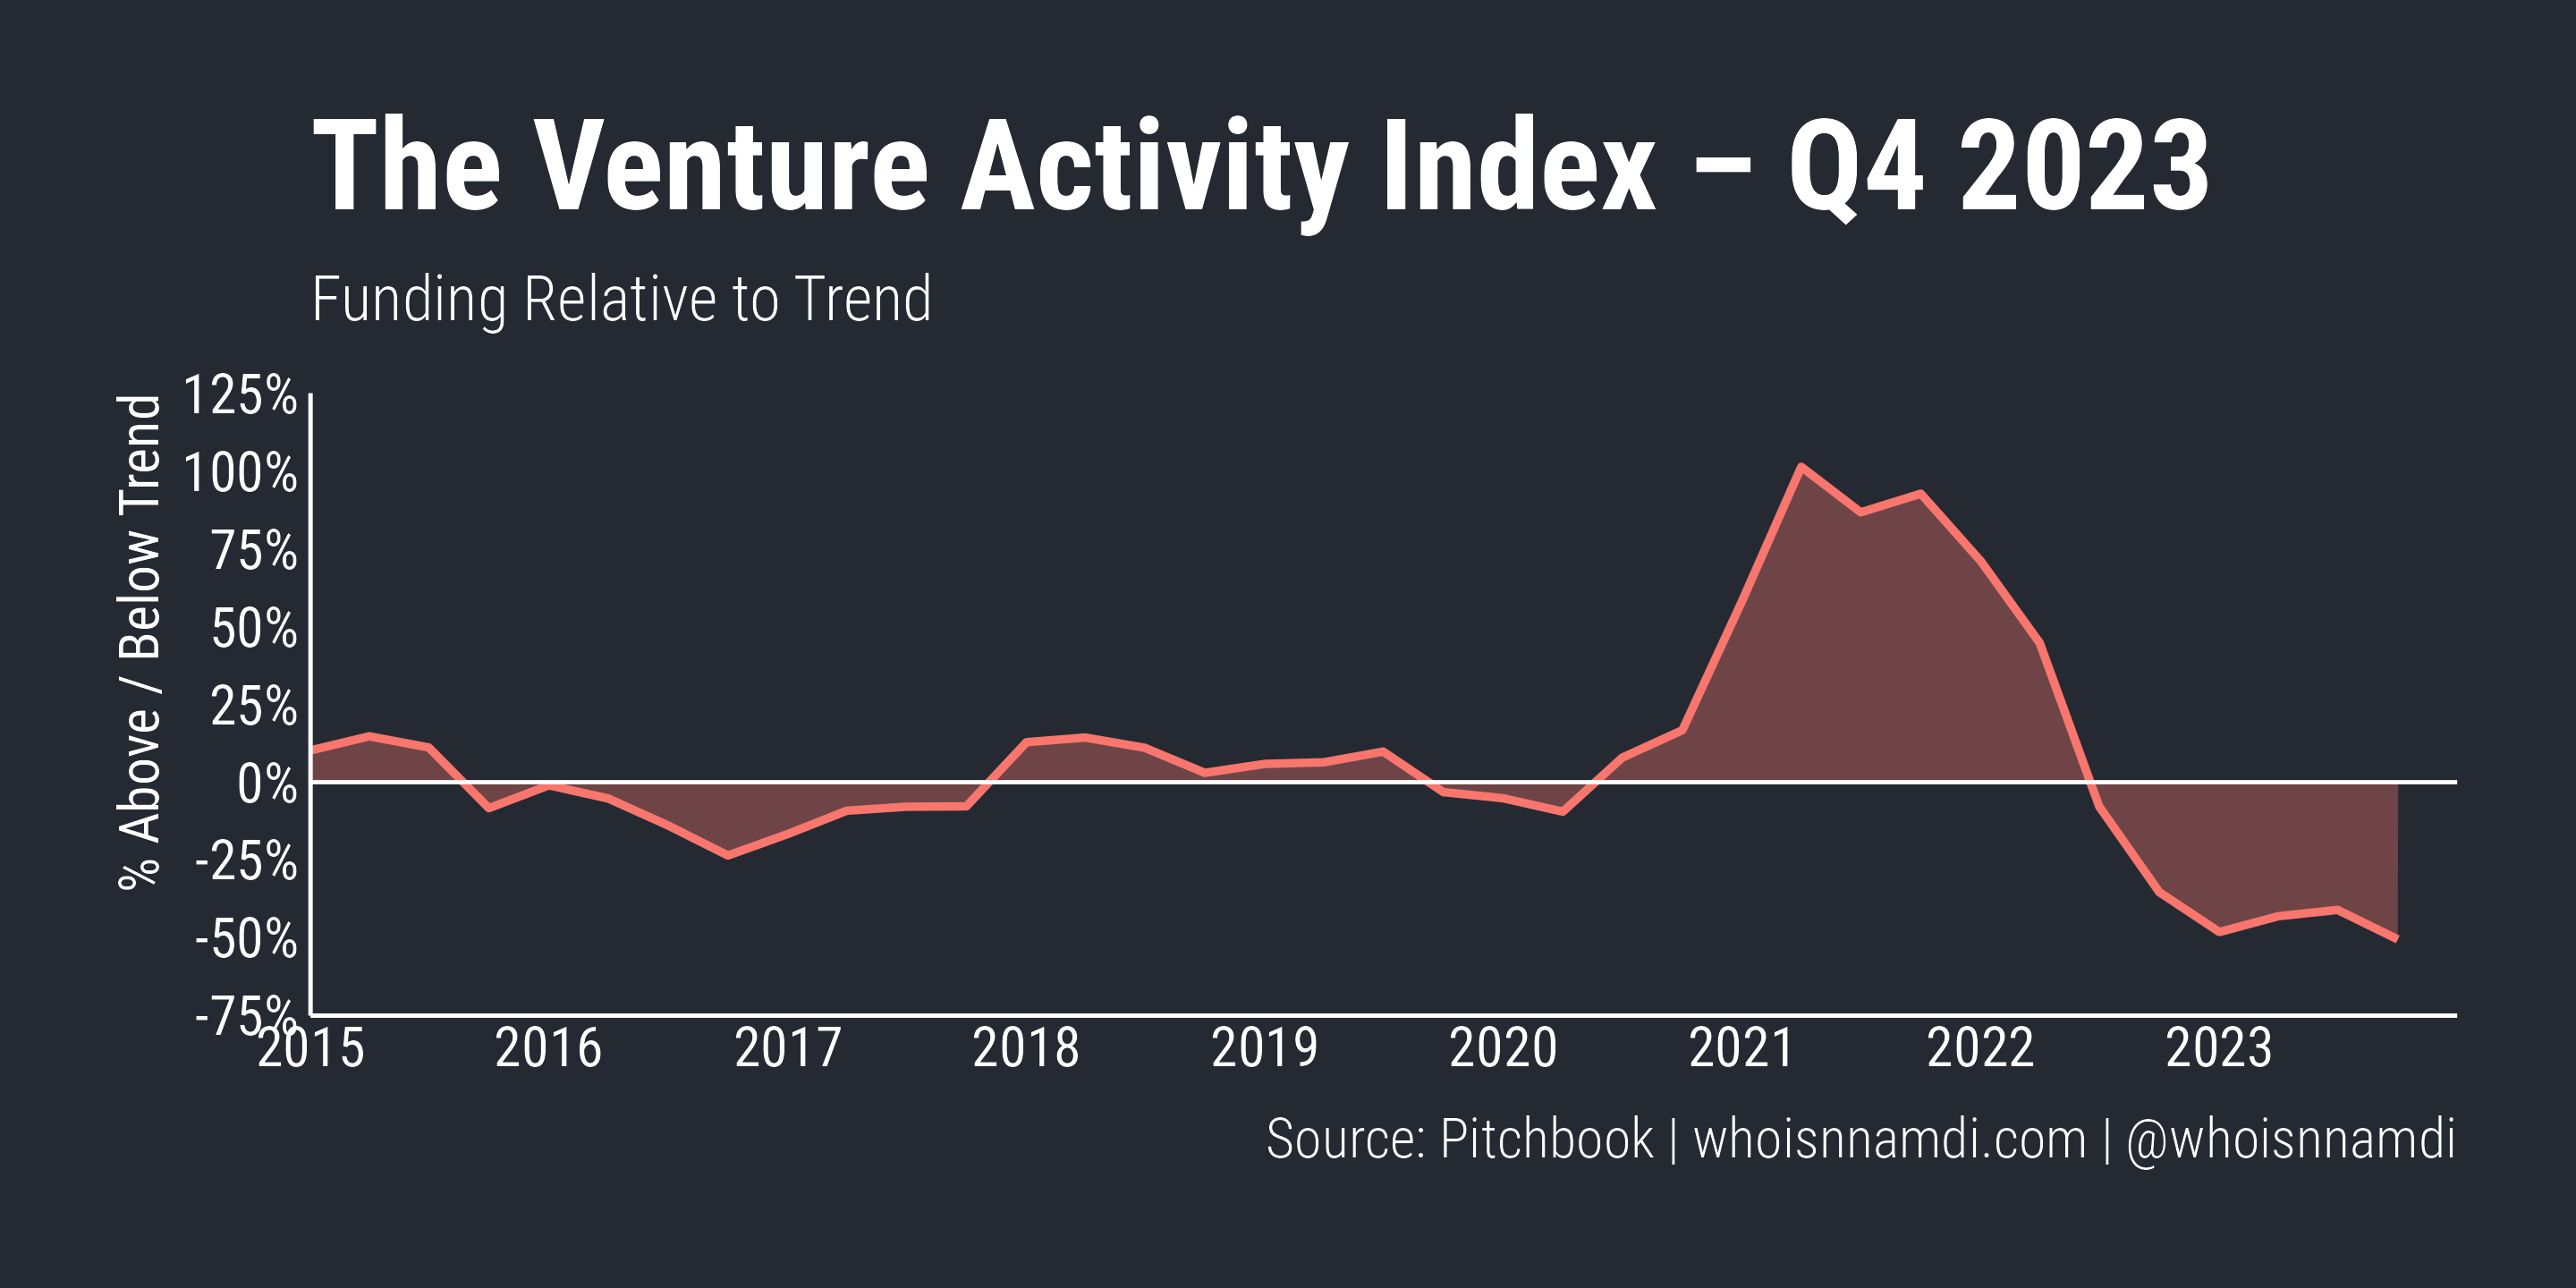
I’ve updated the Venture Activity Index for Q4 2023 data.
As a reminder, the VAI is an index measuring current venture investment across stages relative to the long-run trend. It’s a useful and simple barometer of activity and sentiment in the venture market. The methodology is here.
Some small modifications since the last version of the index that I published in Q2 2023:
- Updated data for Q4 2023
- Removed seasonality from the data
- Removed super later stage rounds post-Series D. This was causing excess volatility that wasn’t representative of the overall venture market
Receive my new long-form essays
Thoughtful analysis of the business and economics of tech
With that out of the way, here’s where we’re at:
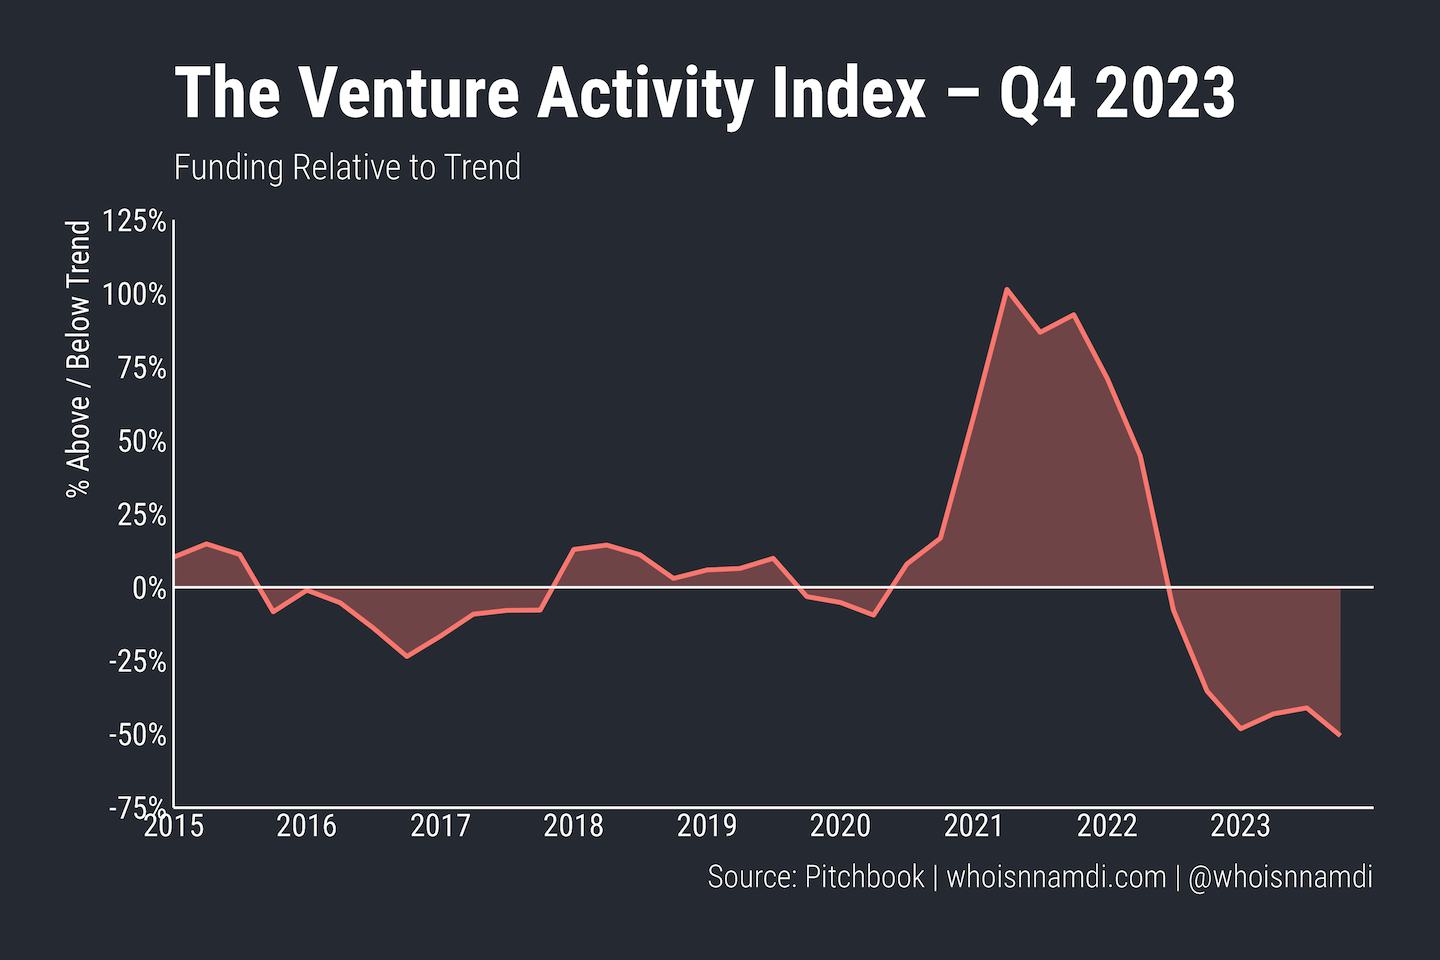
- Capital deployment remains depressed, sitting about 50% below trend
- We’ve hit the trough but remained there rather than recovered to trend. It's a bit of a dead cat bounce
Another interesting view of the data is to show the various components by stage:
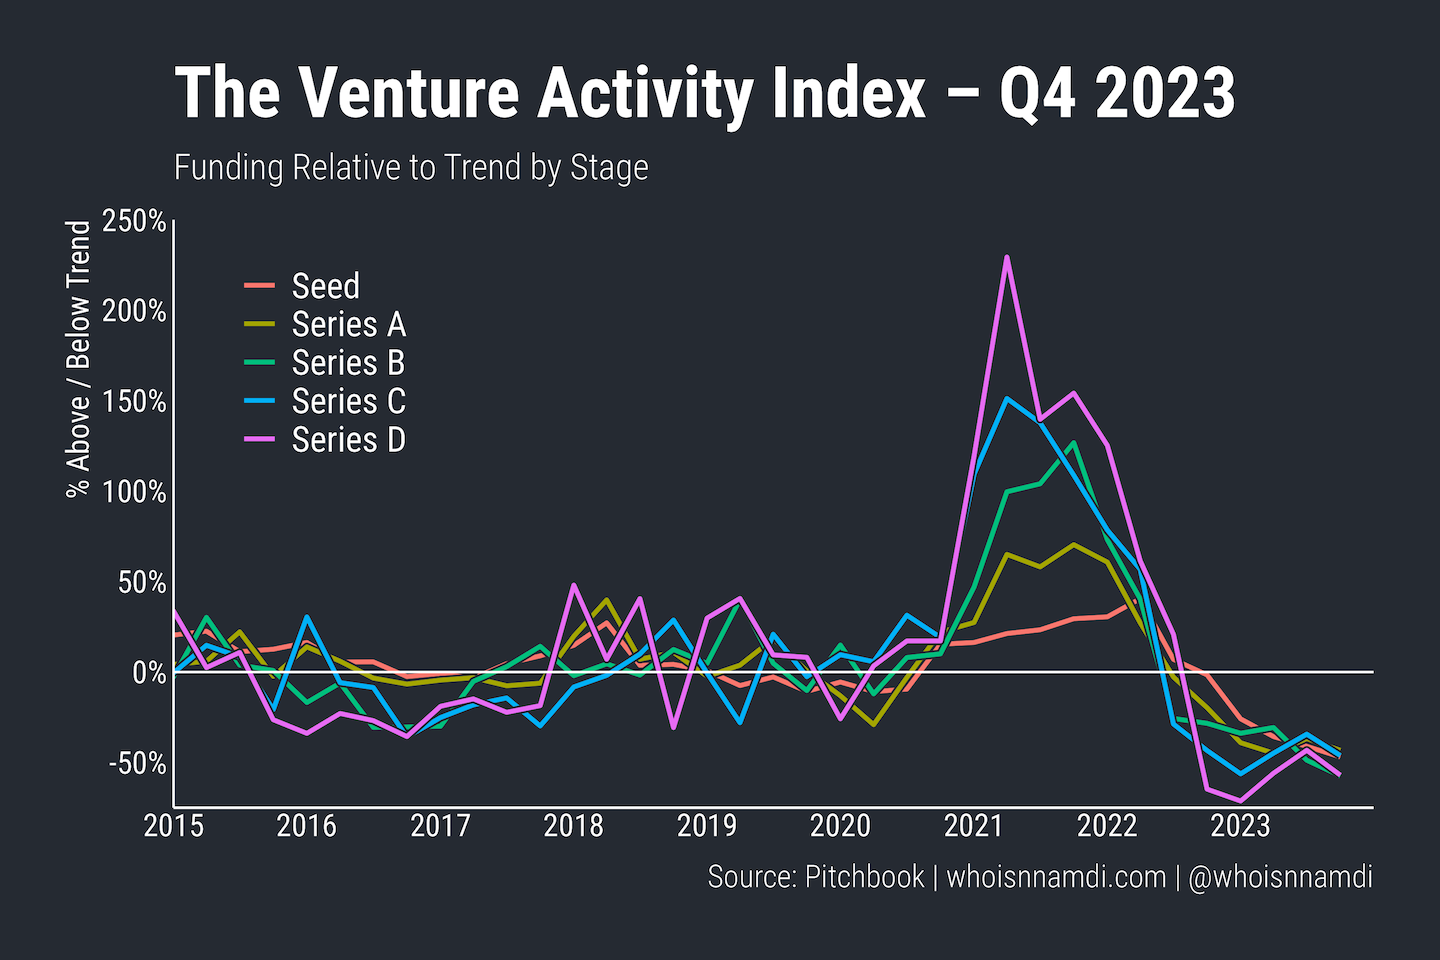
- The later stages spiked the most in 2021, the earliest stages the least. This then reversed, with late stage capital falling somewhat more than early stage capital
- However, all stages are similarly depressed at this point relative to their respective trends
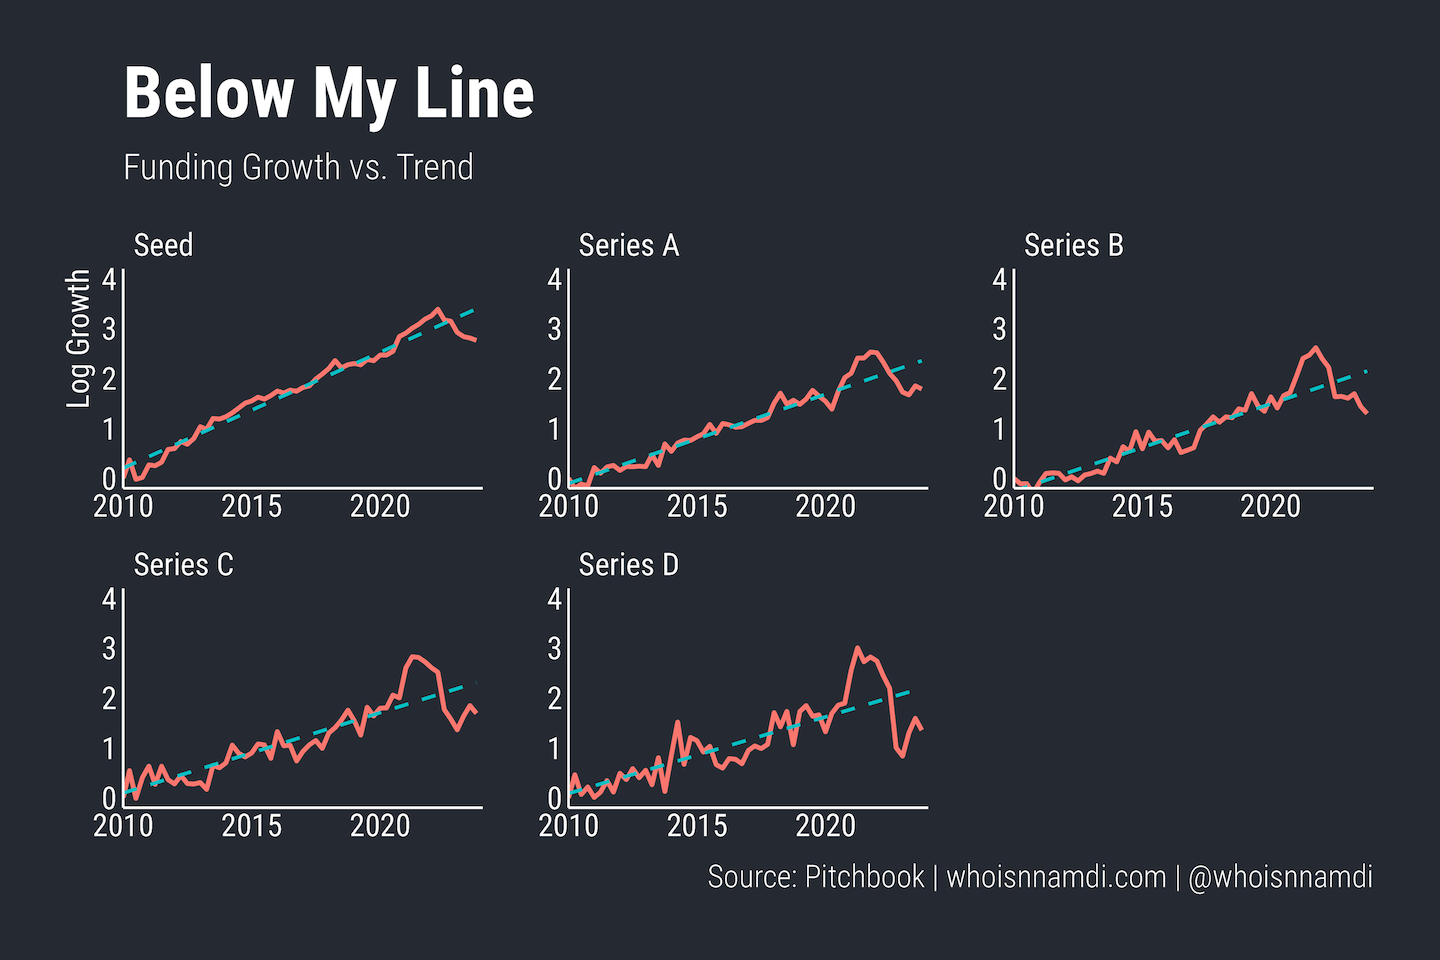
As I caveated in the first version of the index, if we continue to stay below trend I may need to update the definition of trend to recognize that we’re on a new trajectory. For now, I'll continue to use a long-term, constant growth rate to define the trend for each stage:
That's it! I think the data mostly speaks for itself here, so I'll keep my commentary light for this one. Will update this again next quarter.
Receive my new long-form essays
Thoughtful analysis of the business and economics of tech