It's no secret – unless you're building in AI, the venture market isn't very kind right now.
After a euphoric 2021, funding took a nosedive, falling to the lowest pace we've seen in some time. While economists and politicos debate whether we're in an economic recession, there's no debate in the venture economy – it ain't pretty out there for founders trying to raise capital right now.
But that sentiment is somewhat anecdotal, backed by the gut feeling of venture market participants. It'd be great to have a view of the venture cycle that was backed up by the data, some sort of indicator of the phase of the cycle we're currently living through.
So I came up with a methodology for measuring the state of the venture "business cycle" – how the venture market is performing relative to some underlying notion of "trend". Its construction is actually quite simple, and the result is something I think could serve as a useful barometer for the ecosystem as we chart a course from here.
It's called the Venture Activity Index, or "VAI". Let me walk you through how I got there.
Receive my new long-form essays
Thoughtful analysis of the business and economics of tech
Quick stats
To measure the venture cycle, we need a notion of "trend" – the thing around which the venture market is fluctuating. If we plot funding growth on a logarithmic scale across each stage of venture investment, a clear linear trend emerges. (Note: linear trends in logarithms implies constant percentage growth over time):
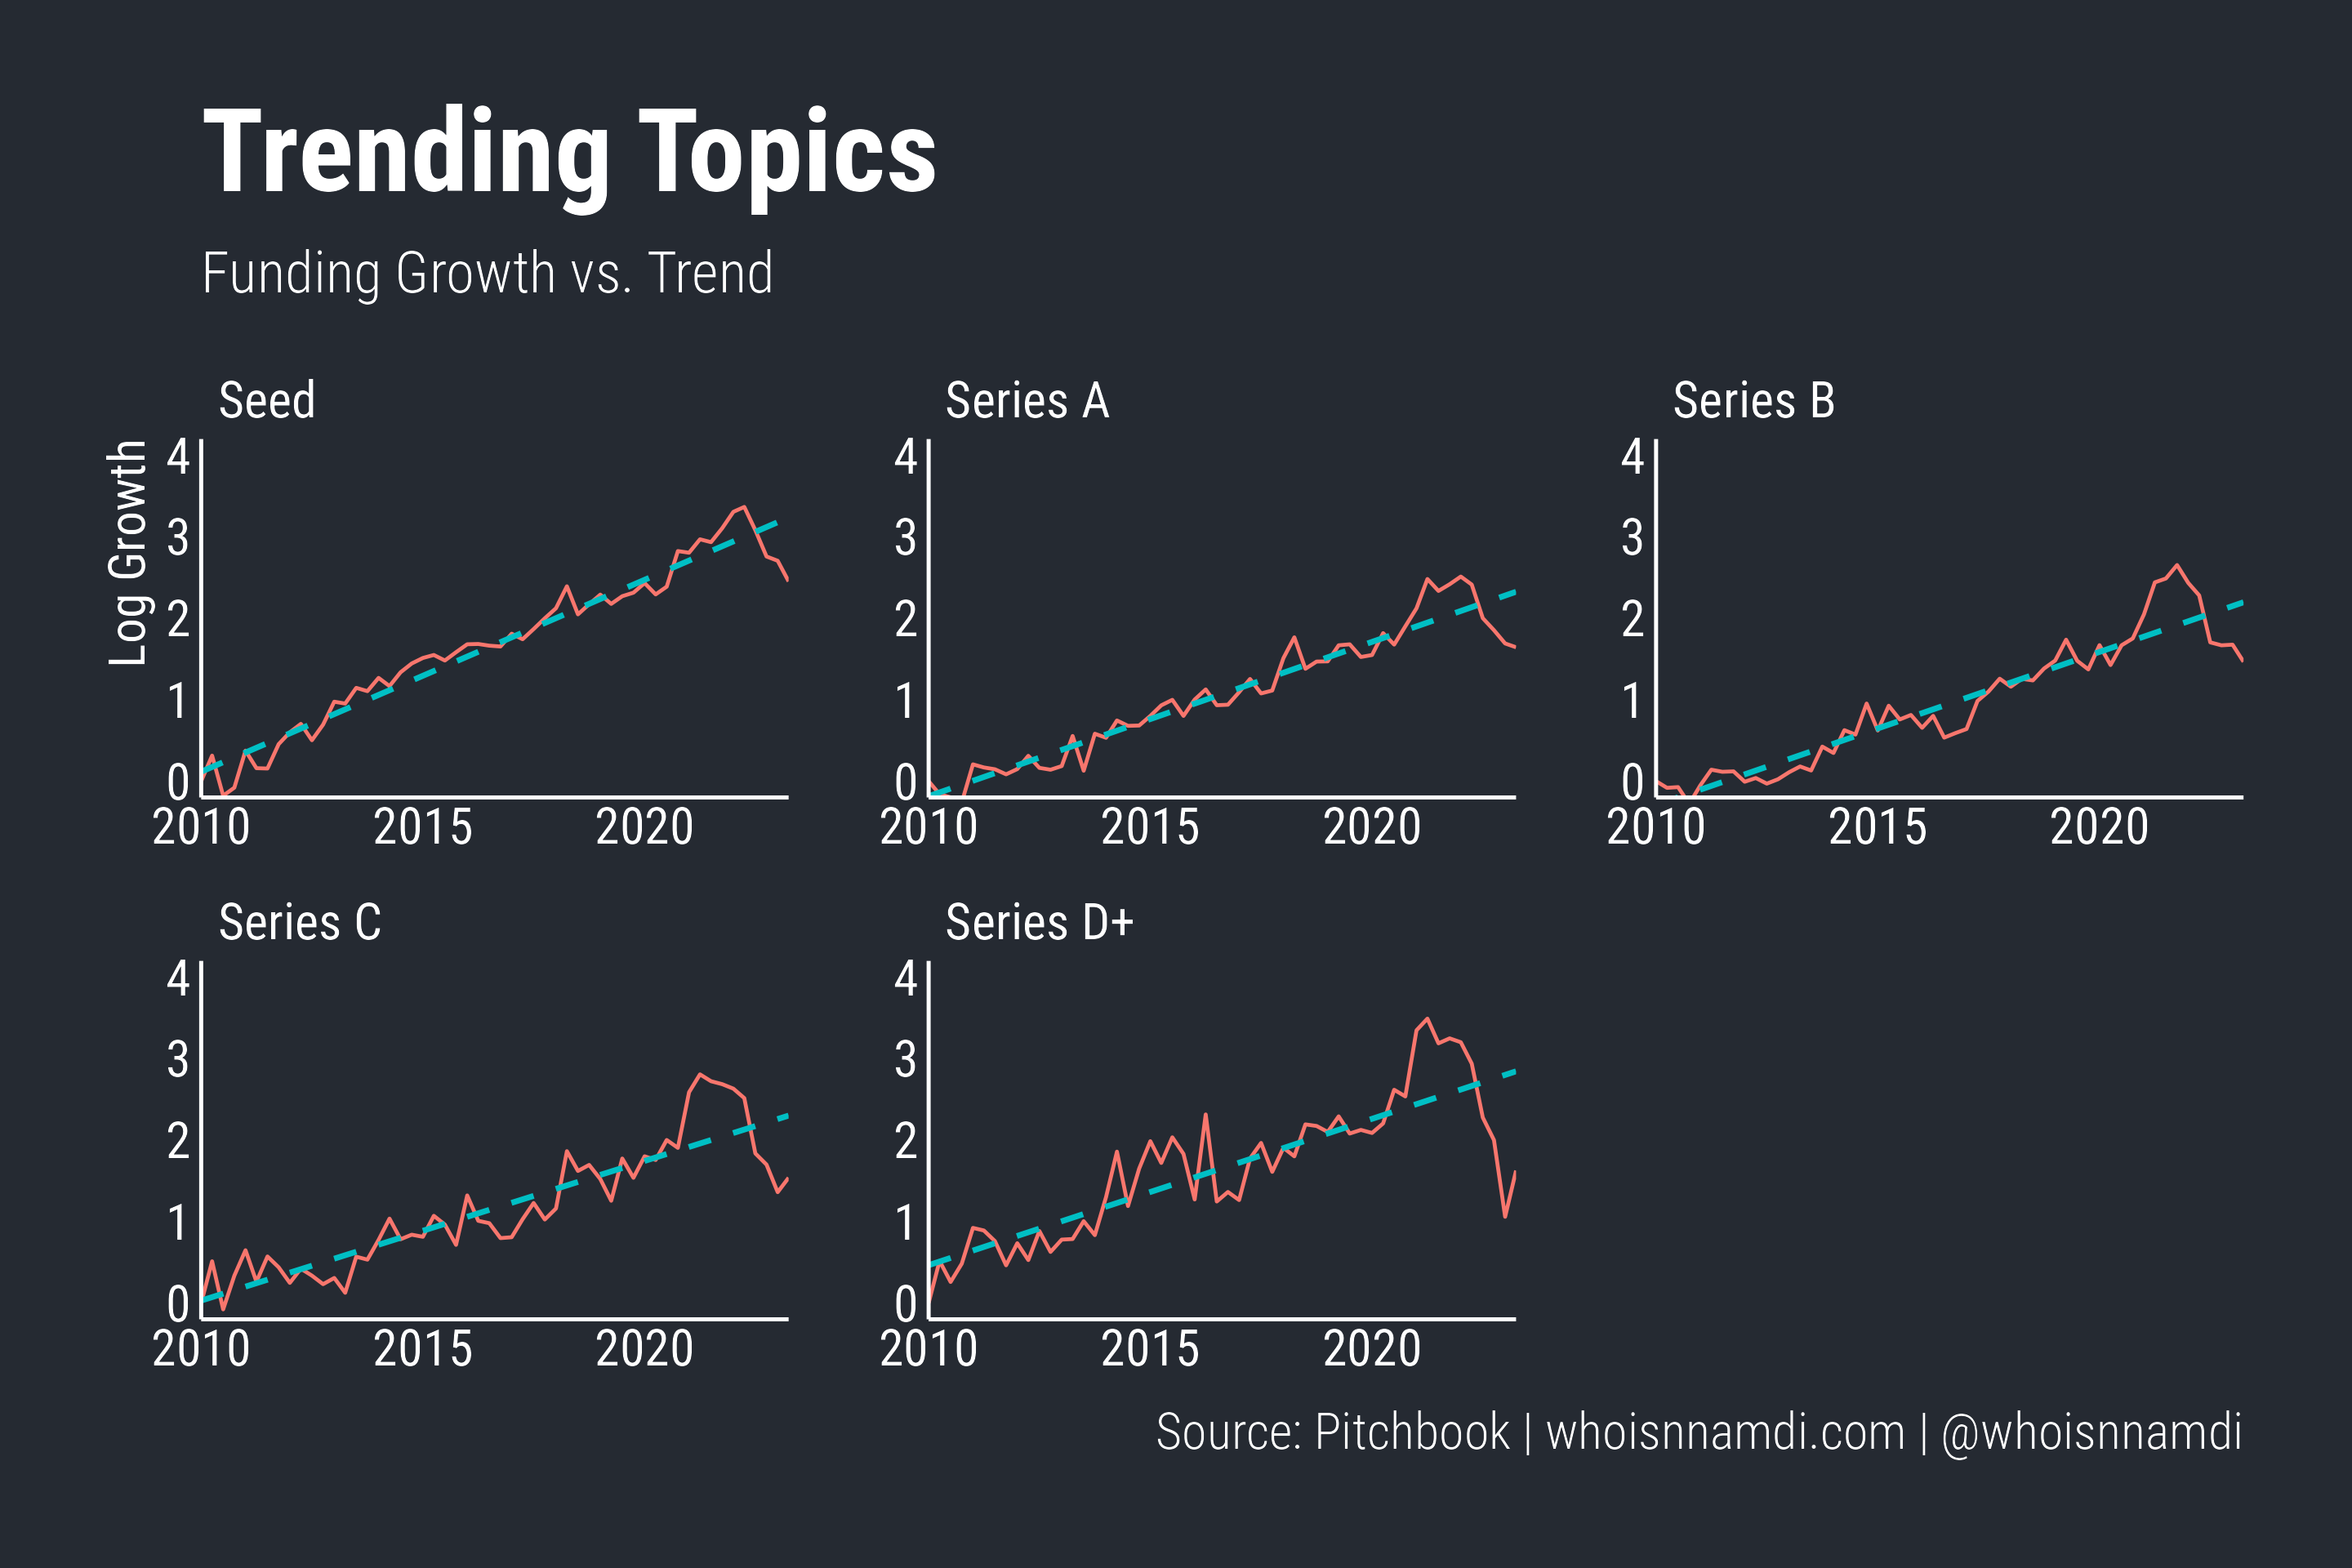
I could have come up with a fancier notion of trend, but I'll proceed with the linear one as it's nice and simple.
Venture activity, as defined by aggregate funding, fluctuates up and down around this trend. The slope varies by stage, but it's a fairly consistent story across stages – on average, funding grows ~5% each quarter.
One quick note: I could have focused instead on the number of investments rather than the scale of investment activity measured in dollars. However, working in dollar terms is nice because it implicitly accounts for valuations, which is critical for holistically characterizing the state of the venture market.
Next, let's remove that trend and focus on the gyrations around it:
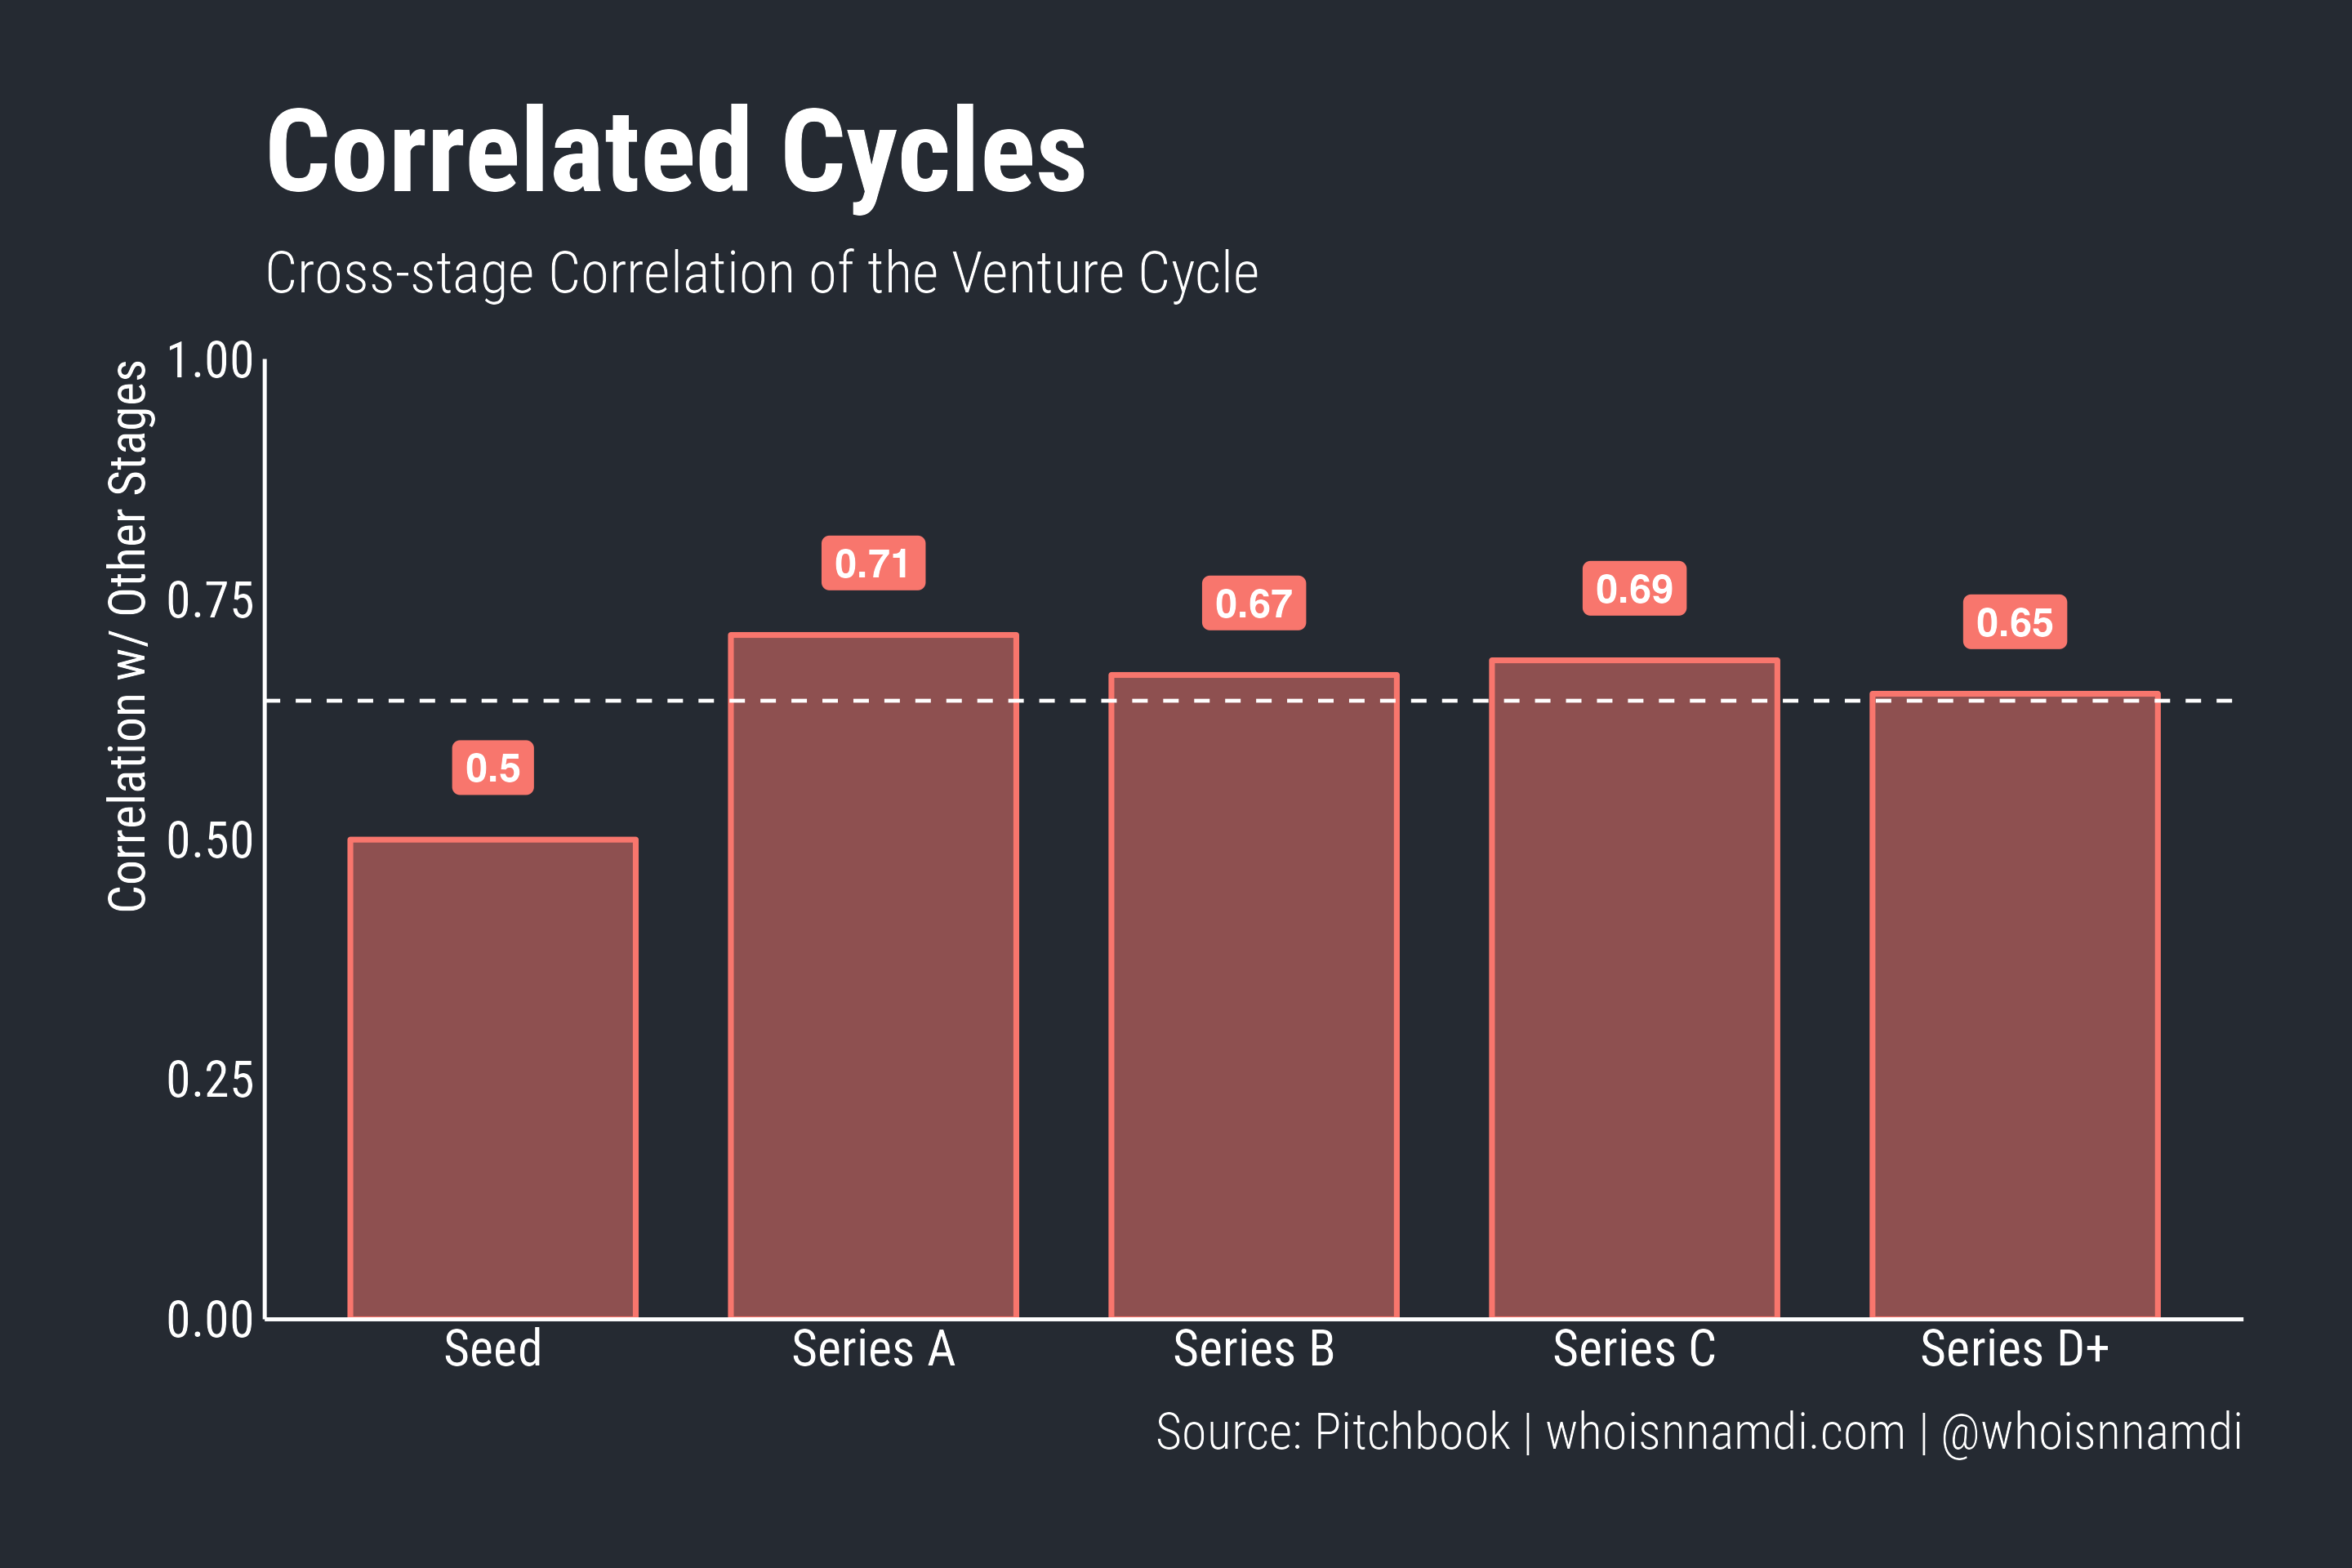
- The cycles were only moderately correlated across stages before 2020. The average cross-stage correlation hovered around ~0.25 pre-2020.
- However, since 2020, they've moved in lockstep, following one common cycle up and then down.
This is typical in economic data: in volatile times, different parts of the market often become much more tightly correlated. It's interesting to see the same phenomenon in the venture data. Further, it's important that the various stages of venture correlate with one another, as otherwise there'd be no sense in talking about a singular "cycle" for the whole ecosystem.
Overall, the correlations are around ~0.65 for the whole period, with the seed stage being the most dissimilar to the other stages of investment:
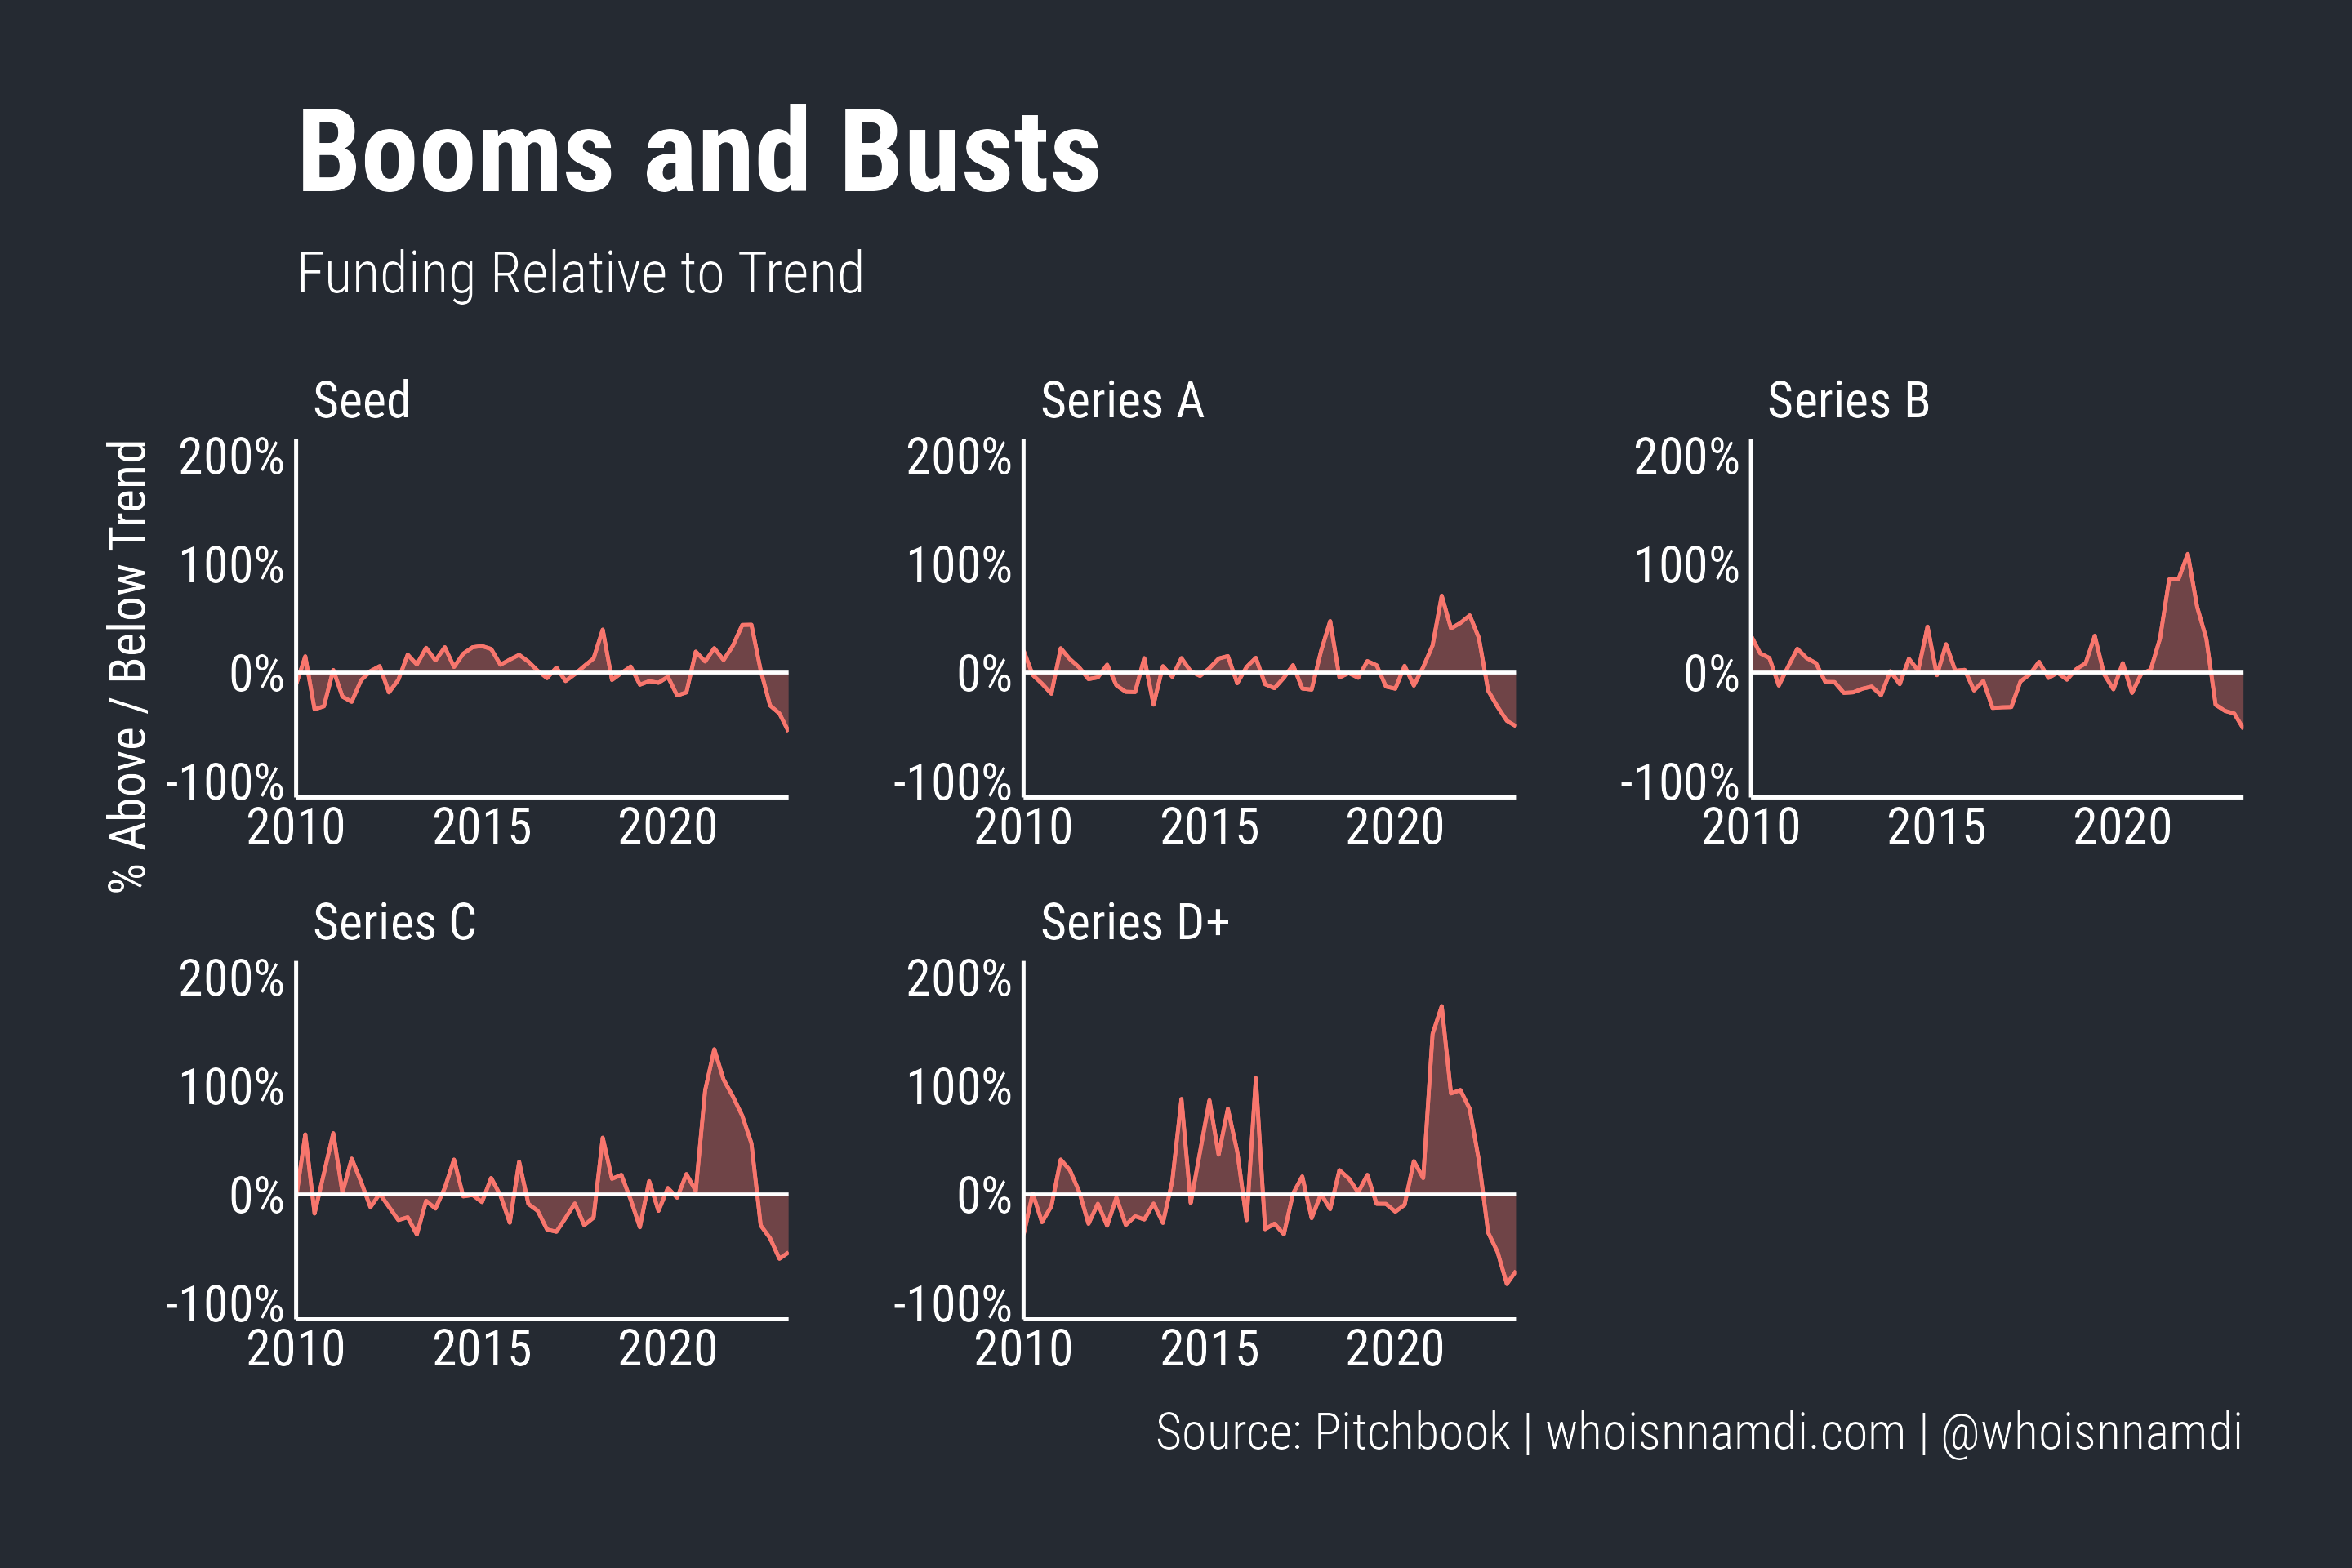
The amplitudes of the cycles, however, differ across stages, both historically and more recently:
- The seed stage is relatively steady, never more than 50% off trend, with a quarterly standard deviation across time of about 20 percentage points.
- Series A is a bit more volatile but not significantly so.
- Growth and later stages are the most volatile, ranging from a standard deviation of ~30 p.p. for Series B all the way to ~50 p.p. for Series D+.
In other words, booms and busts are substantially larger at the later stages:
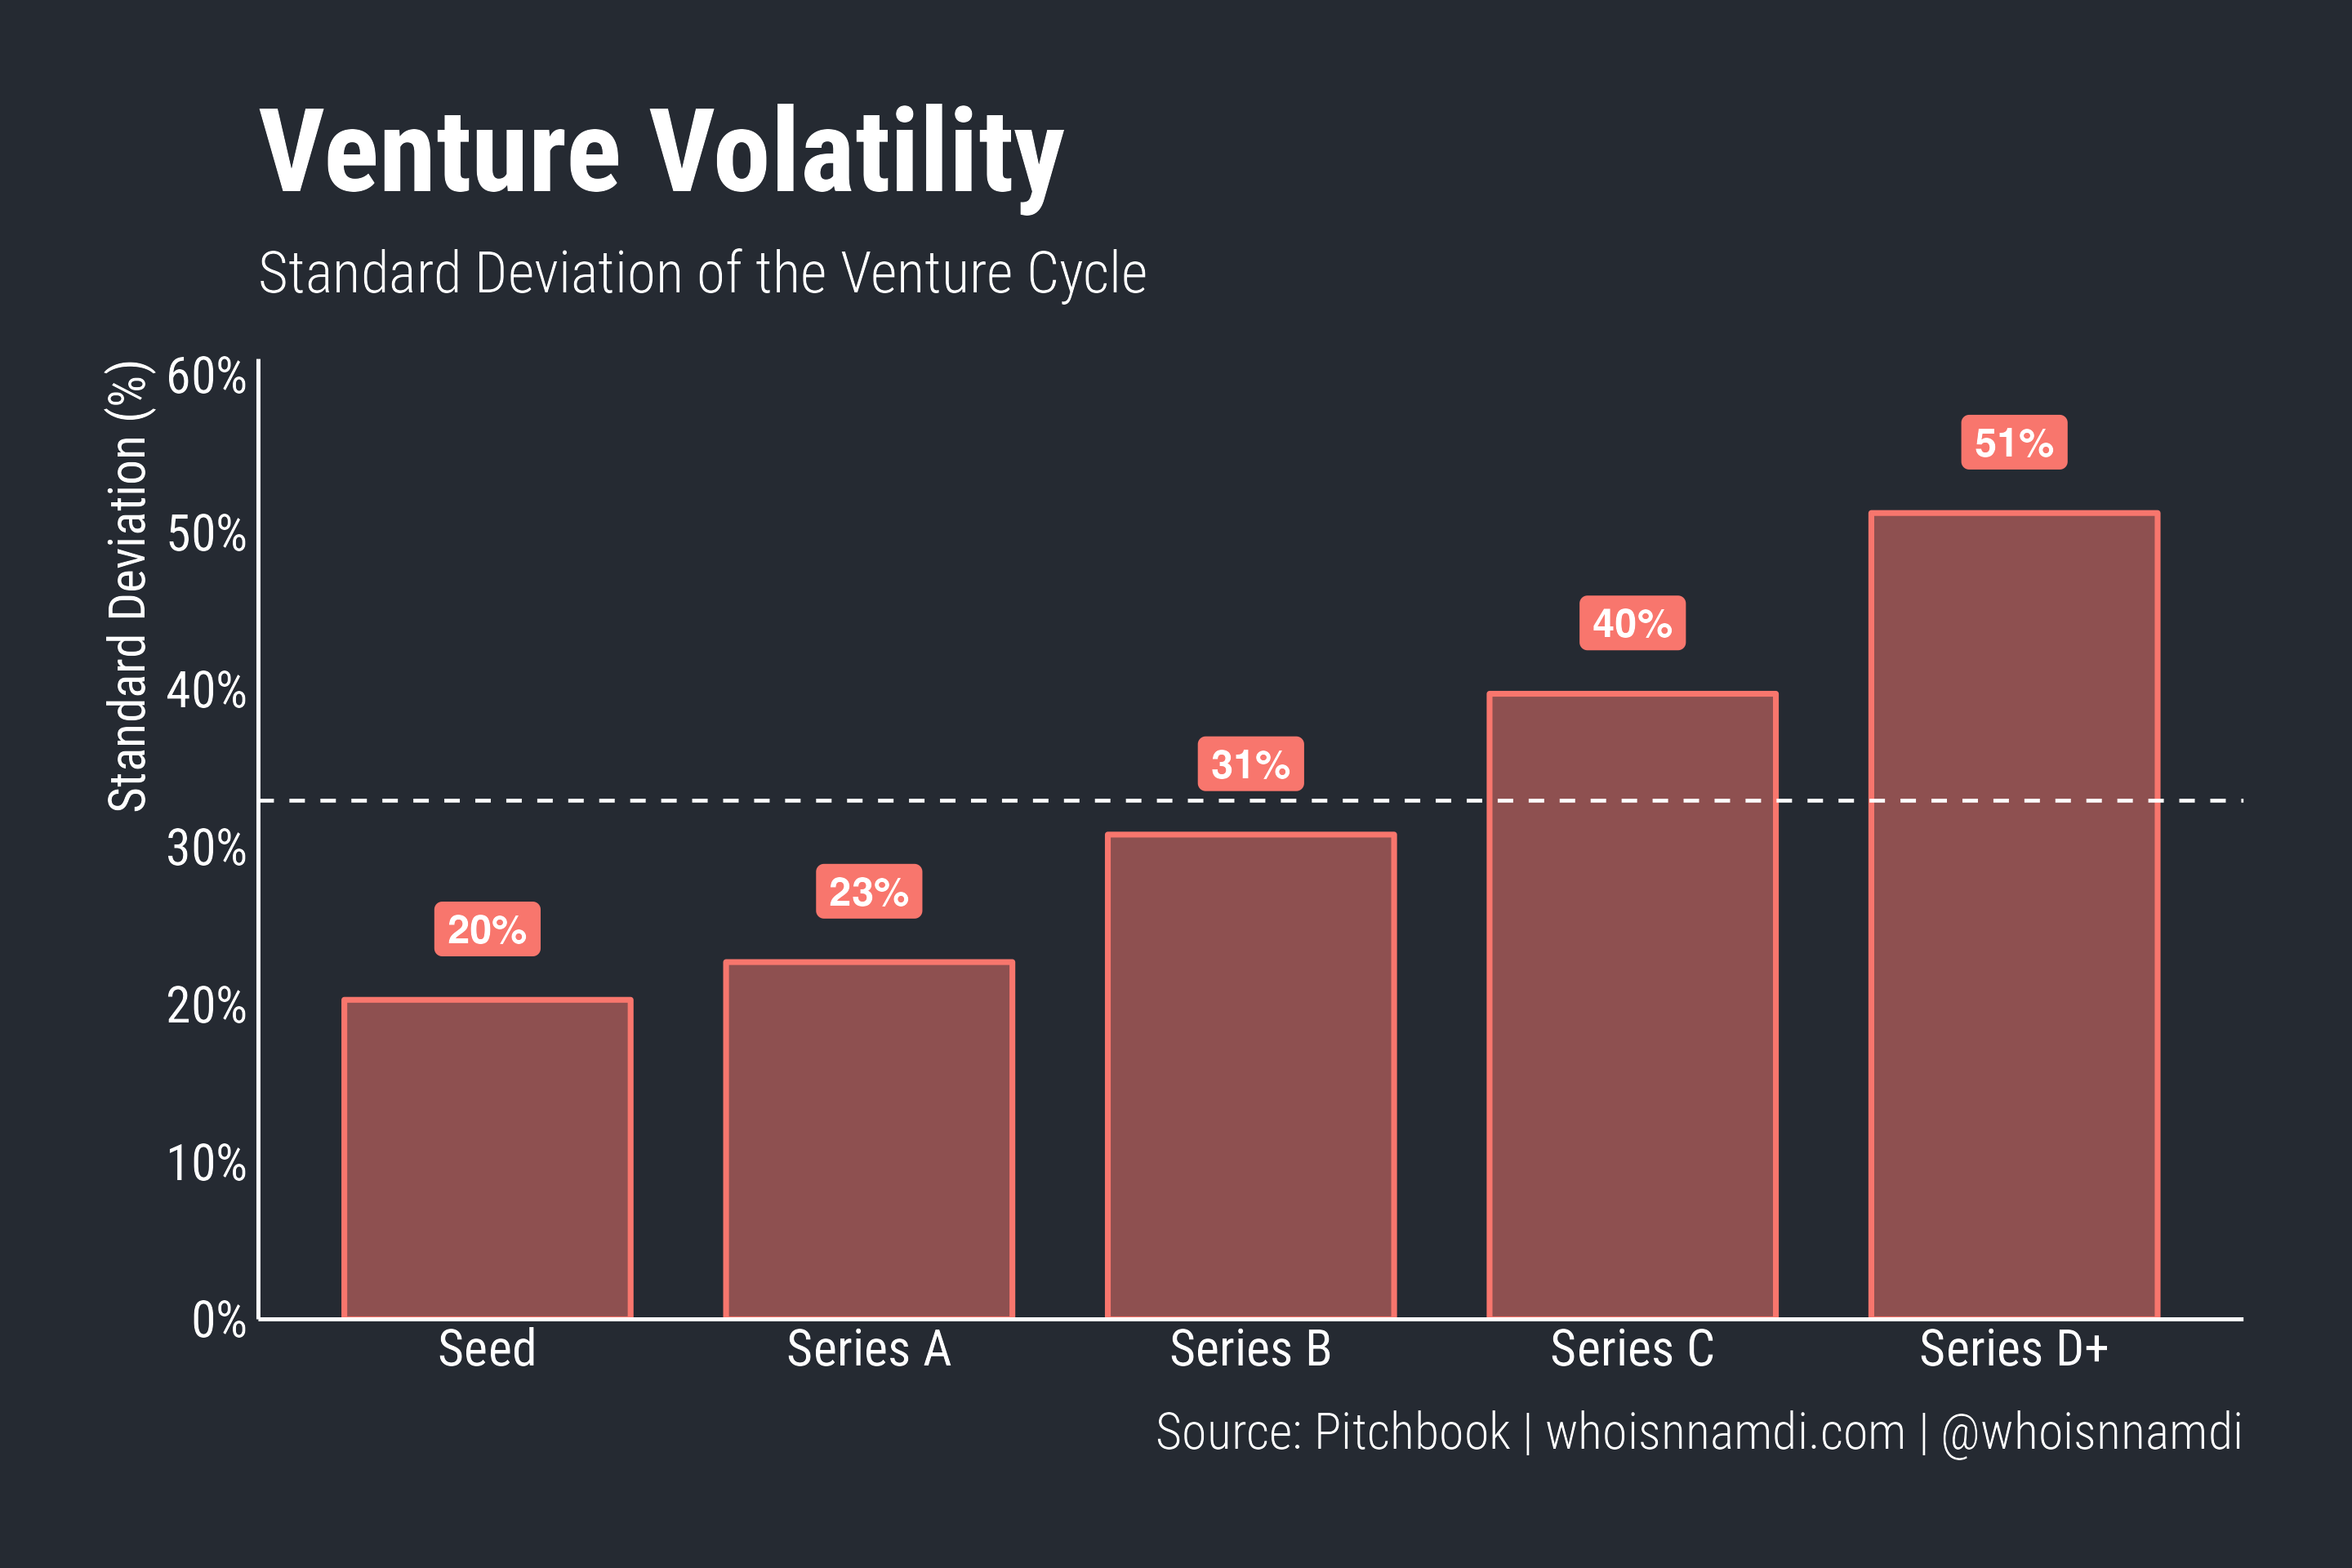
And in case you're wondering, this was true before 2020 as well. It's not just a recent phenomenon: the late-stage market has always required a bit of a strong stomach.
One metric to rule them all
Now let's throw it all together. Again, in the spirit of simplicity and robustness, let's take the simple average of the individual trends to arrive at a blended view of the venture ecosystem.
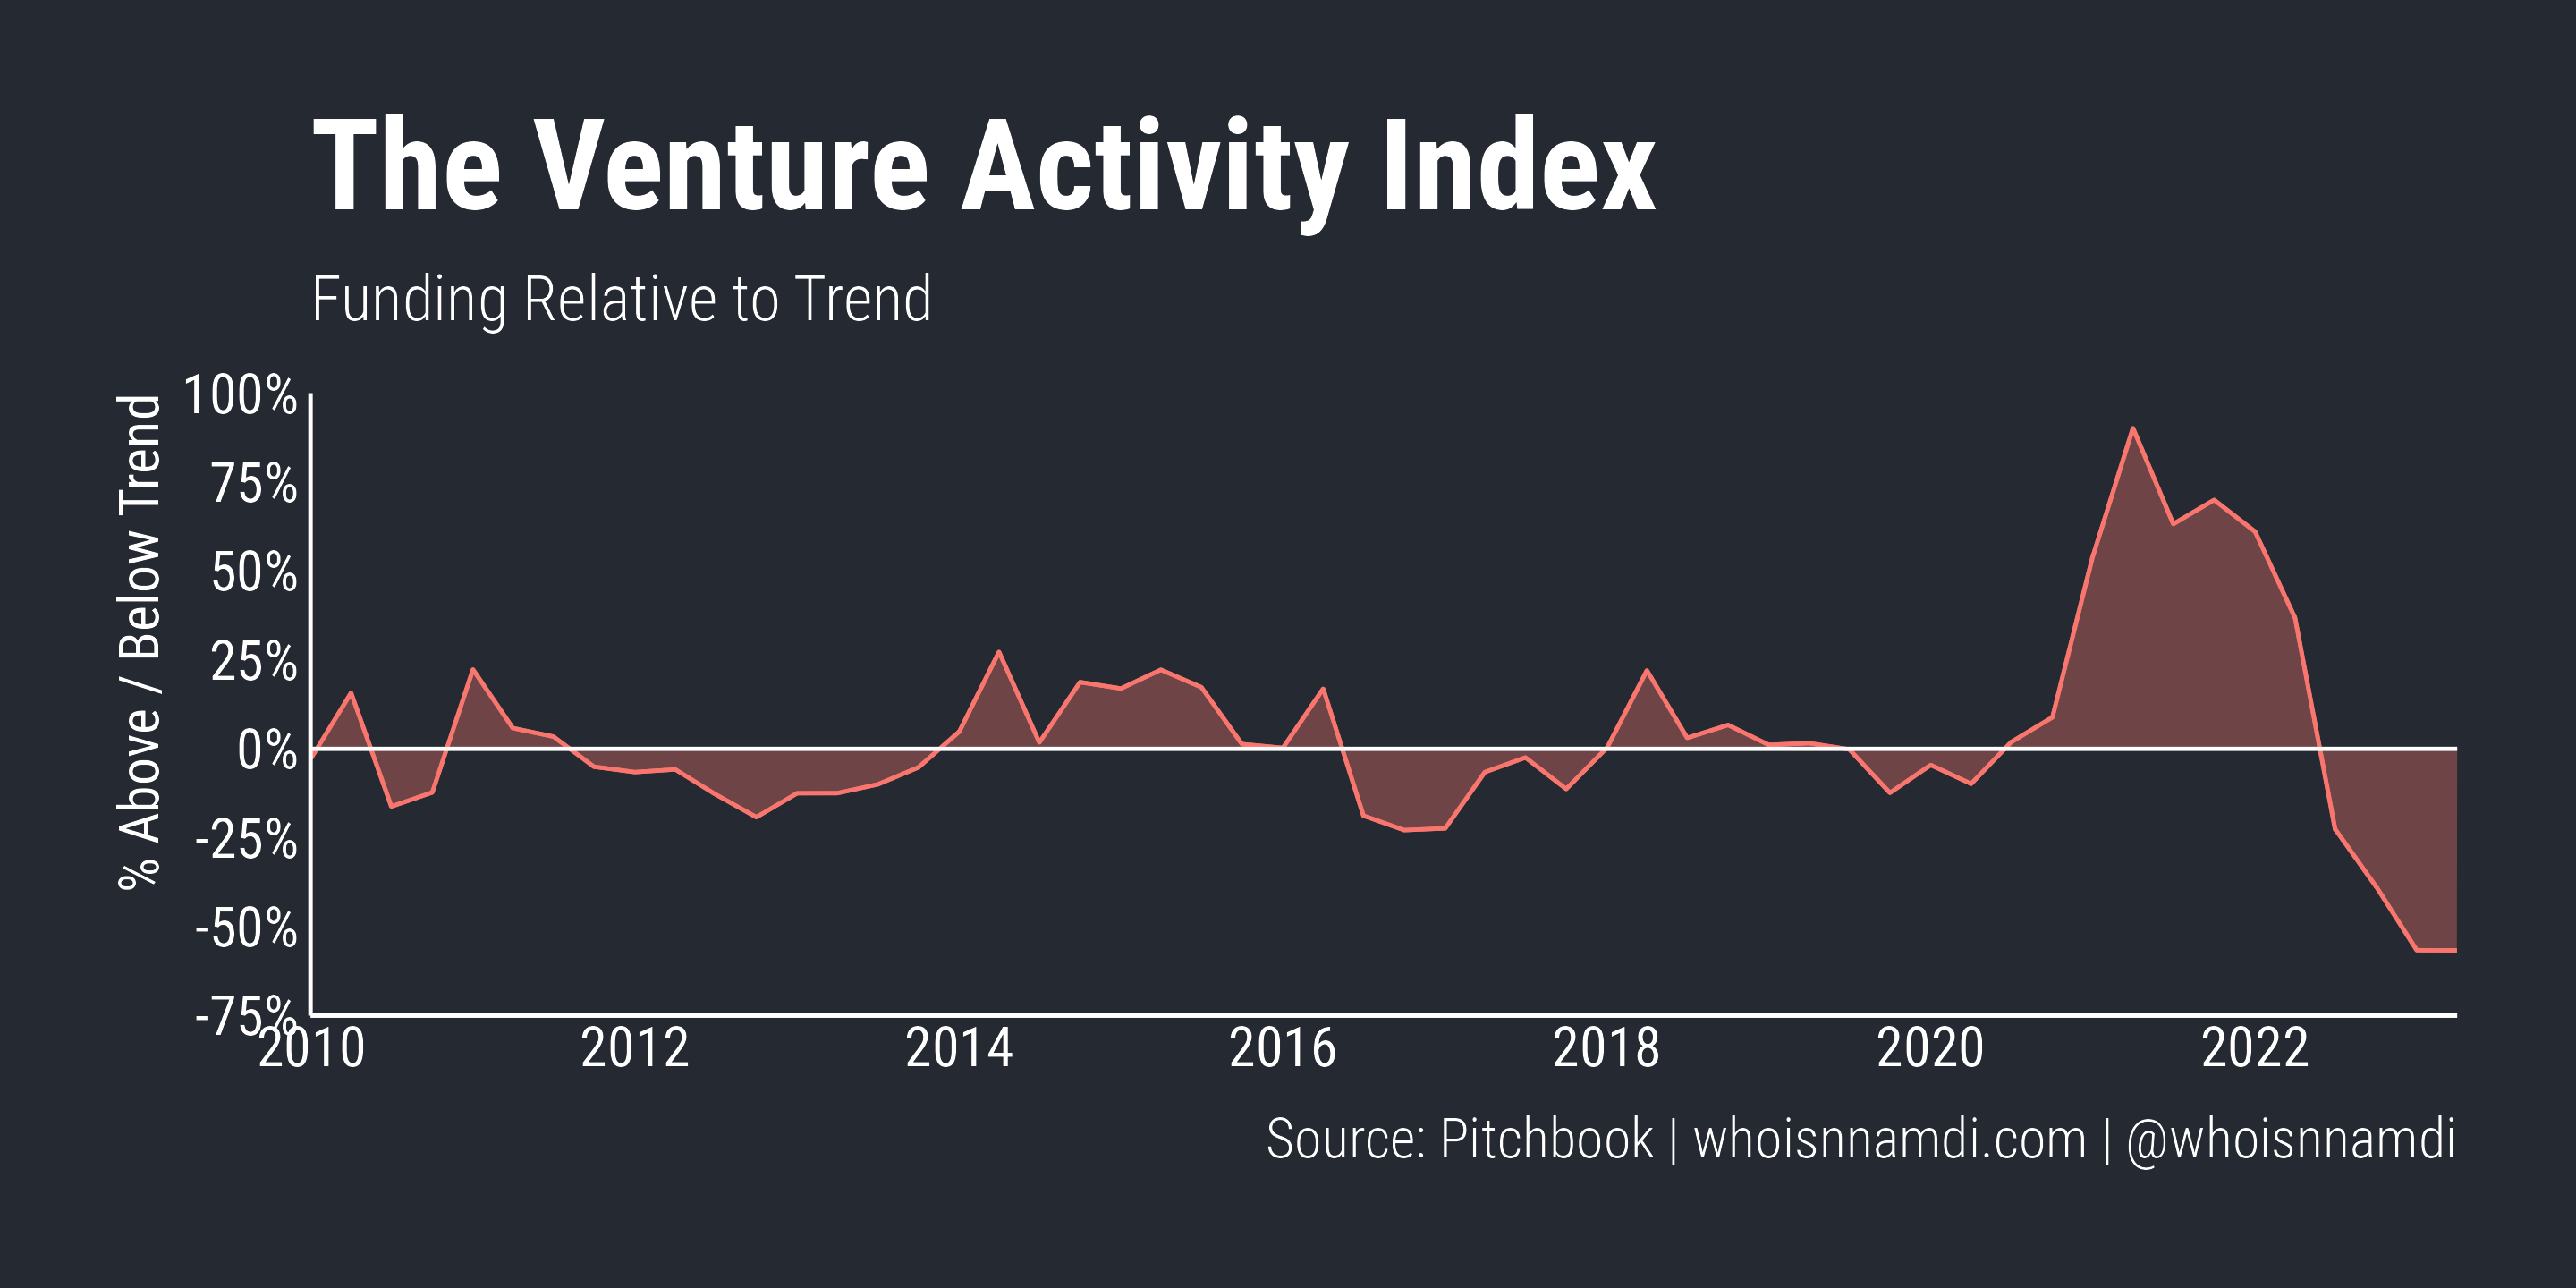
I present to you… the Venture Activity Index (VAI):
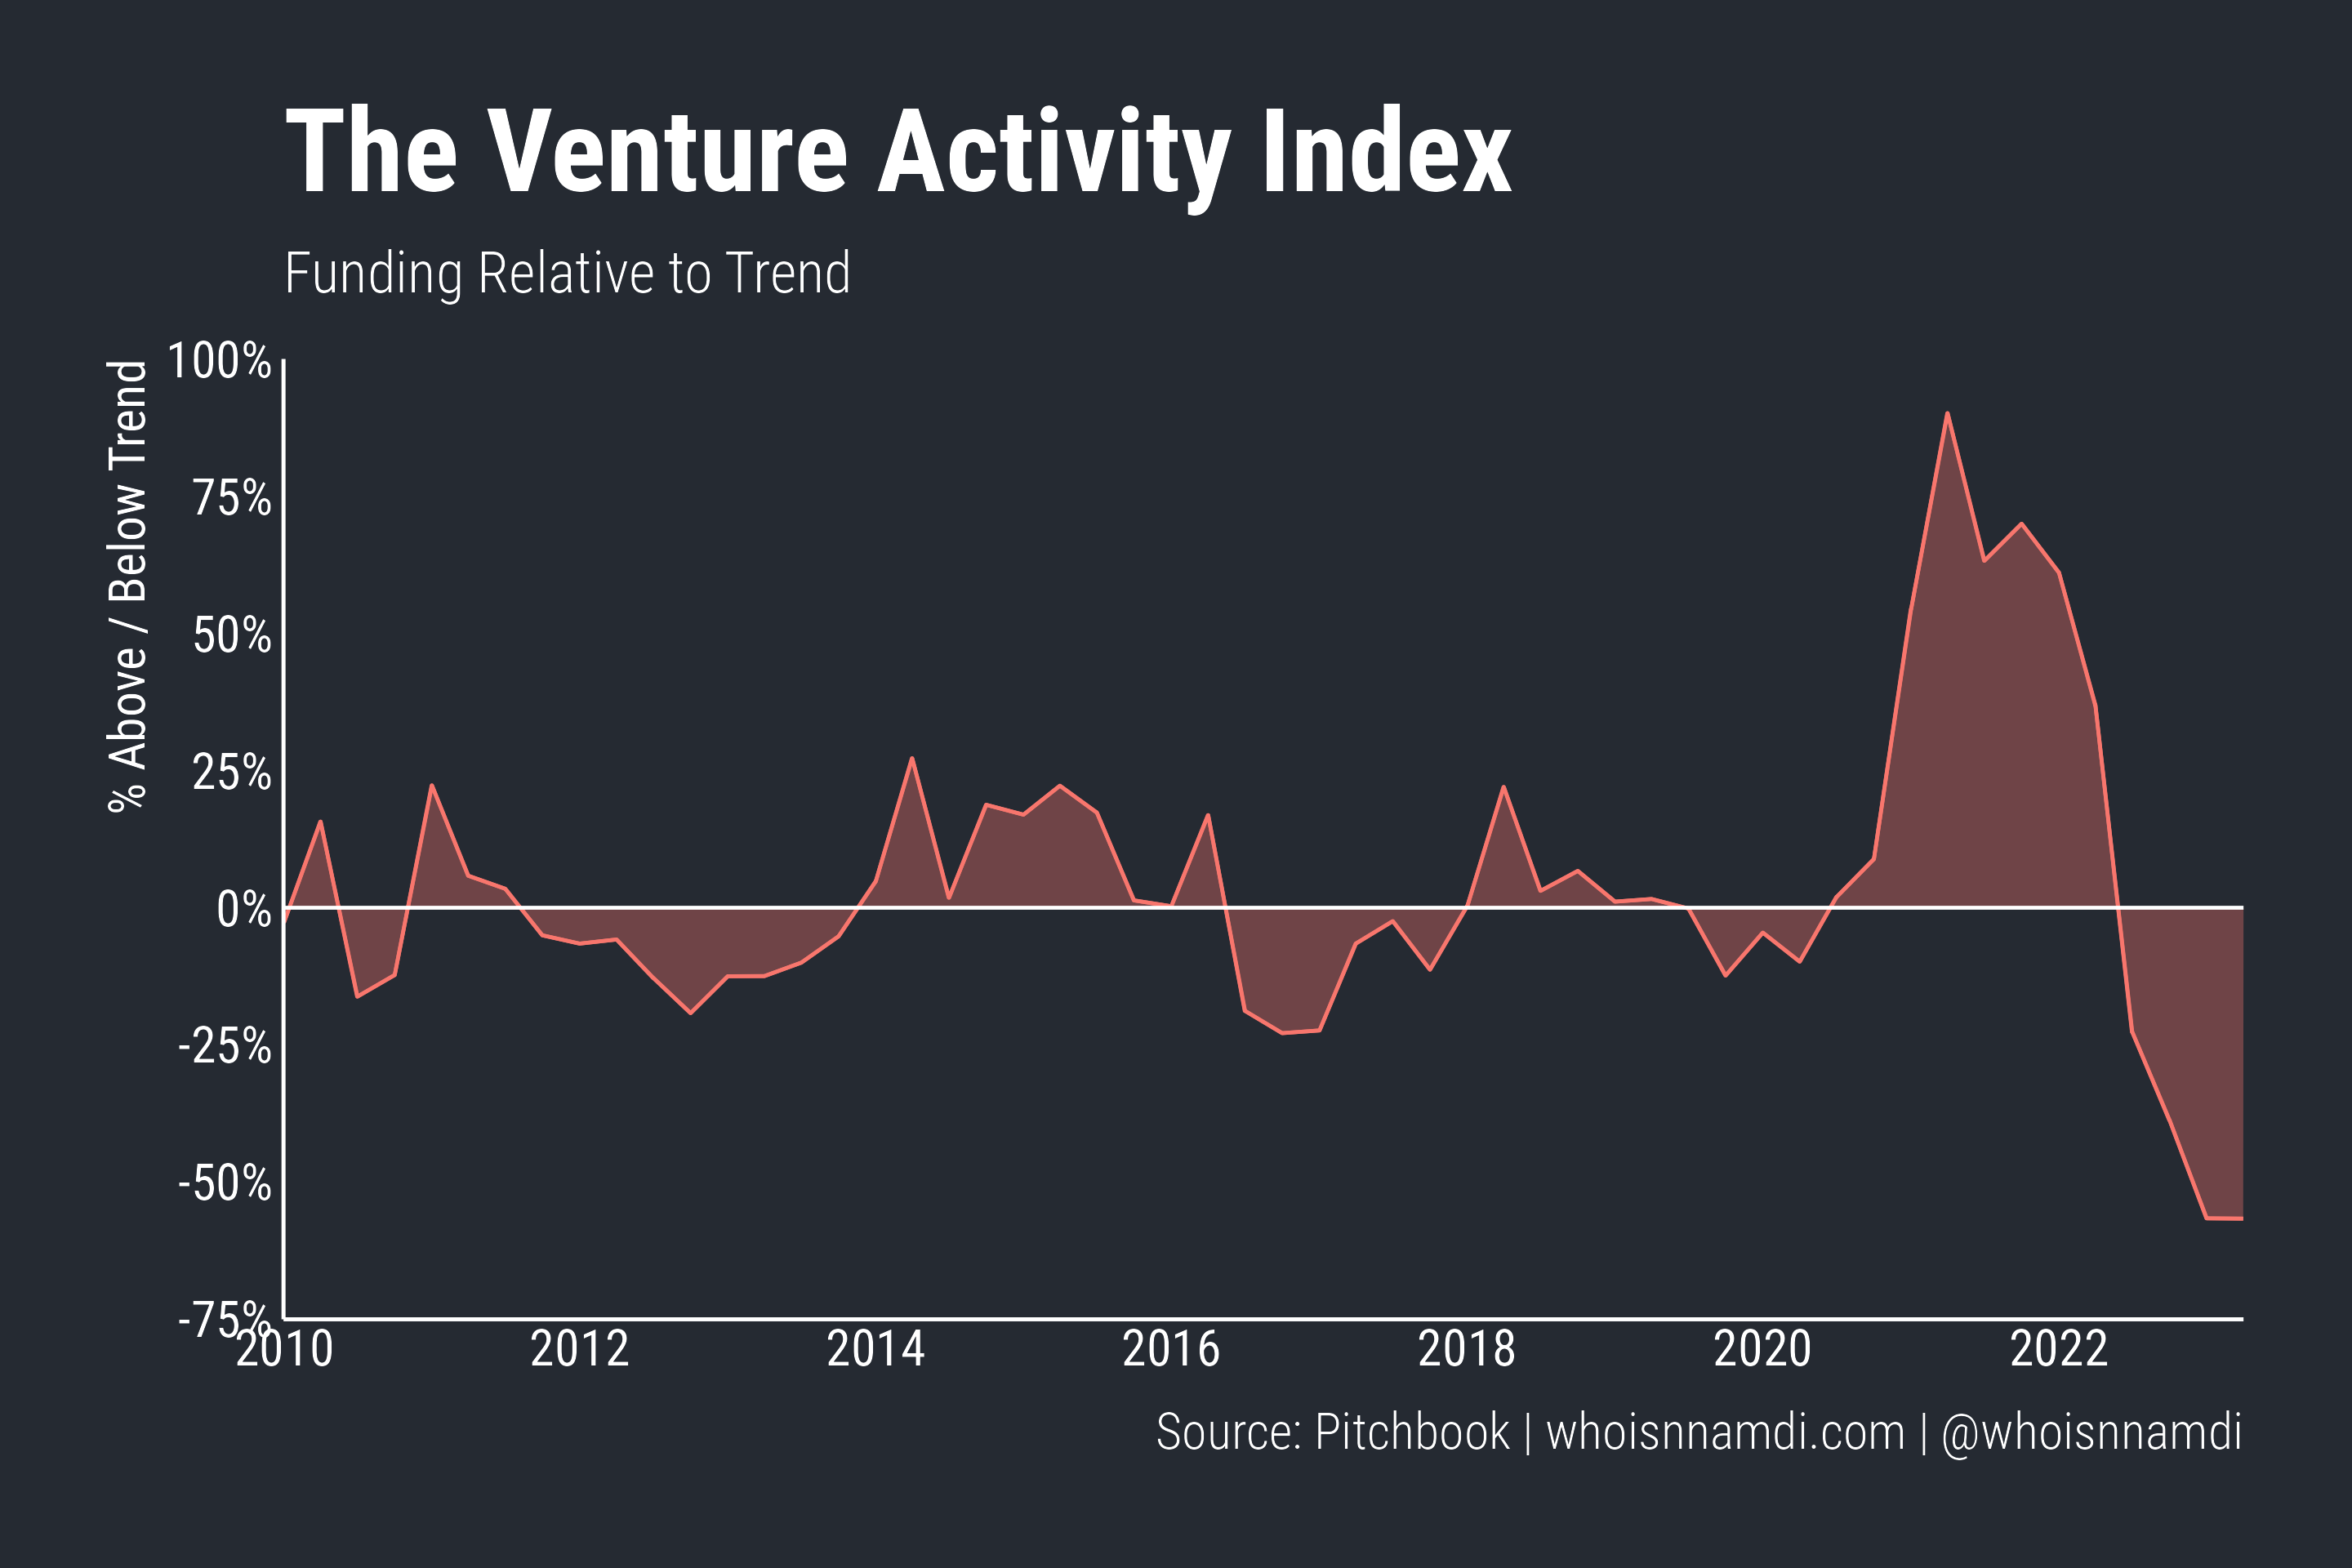
The last three years of the VAI are the obvious anomaly:
- Capital deployment rose to 90% above trend, exploding over only a few quarters.
- The correction was just as vigorous, bottoming out at ~60% below trend and stable for the last two quarters.
We haven't seen anything like this in the prior ten years of activity. Previous peaks and valleys were at most +/-25%. The volatility of the last three years is unheard of in recent memory.
When knocked off trend, venture activity returns to steady state after ~1.5 years. Only in that sense was the exuberance of 2021 relatively normal – it lasted roughly as long as such booms tend to last. We'll see if that behavior continues.
Again, I want to emphasize this is a measure of the venture business cycle, not the trend itself, which we first removed. A rise or decline in the VAI implies funding grew faster or slower than trend, respectively, not that funding rose or fell in absolute terms.
Due to its cyclic nature, the VAI forecasts future changes in venture activity. When it's high, future venture activity slows. When it's low, venture activity accelerates in the next few quarters. This is true across stages, though it's most accurate for the later stages:
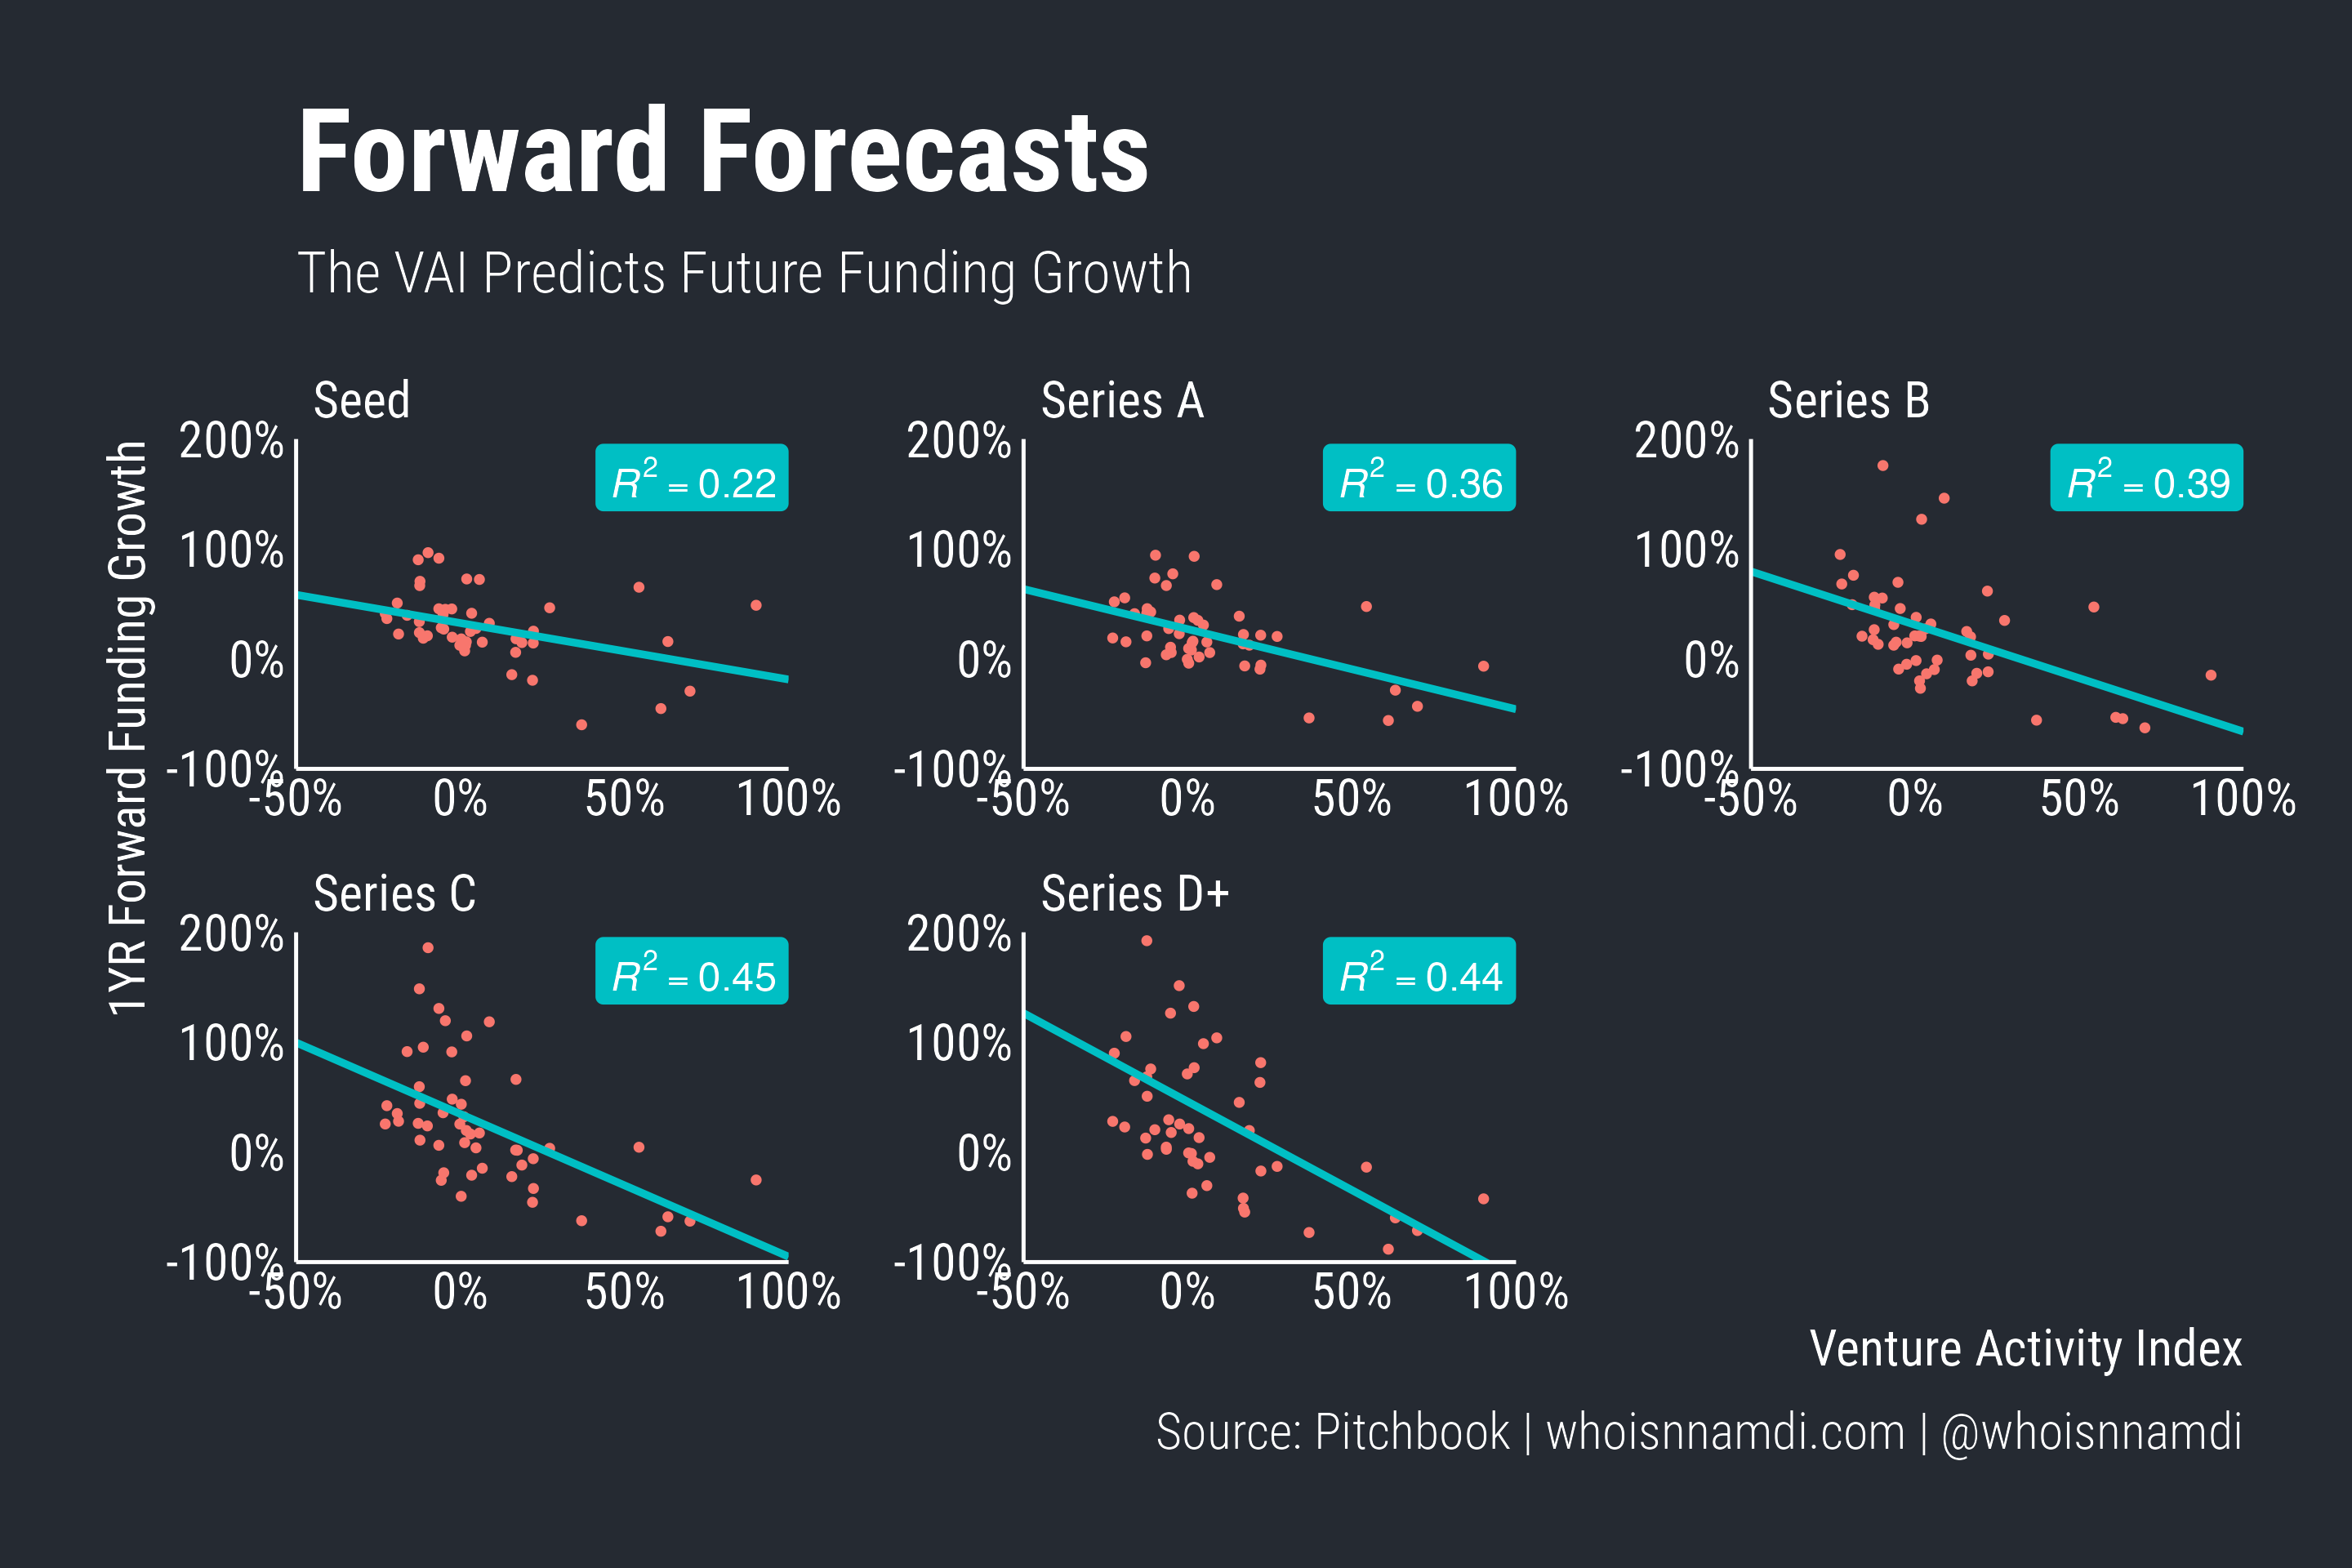
Overall, a 10% increase in the VAI forecasts anywhere from a 6.5% decline in seed stage venture funding over the next year to a 21.5% decrease at the Series D+ stage (and vice versa for a decrease in the VAI).
Conclusion
The Venture Activity Index is a simple and informative indicator of the state of the venture "business cycle". In a single number, it quantifies the "gut feelings" we all have about the venture climate today, in the past, and in the future.
To wrap up, a few caveats:
- The backward-looking trend updates every quarter, which can slightly change the historical numbers as new data comes in.
- A linear trend may not make sense in the long-run. For example, if the rate of capital deployment never returns to its prior trend, at some point we'd have to accept that a new trend has been established, making the old one irrelevant. I may later change my calculation of trend to address this.
- My simple average of the various stage-specific trends could be improved upon with some sort of factor analysis technique. Again, I may switch to this at a later date.
I plan to update the VAI quarterly as new data comes in. For the latest data, look here.
Receive my new long-form essays
Thoughtful analysis of the business and economics of tech